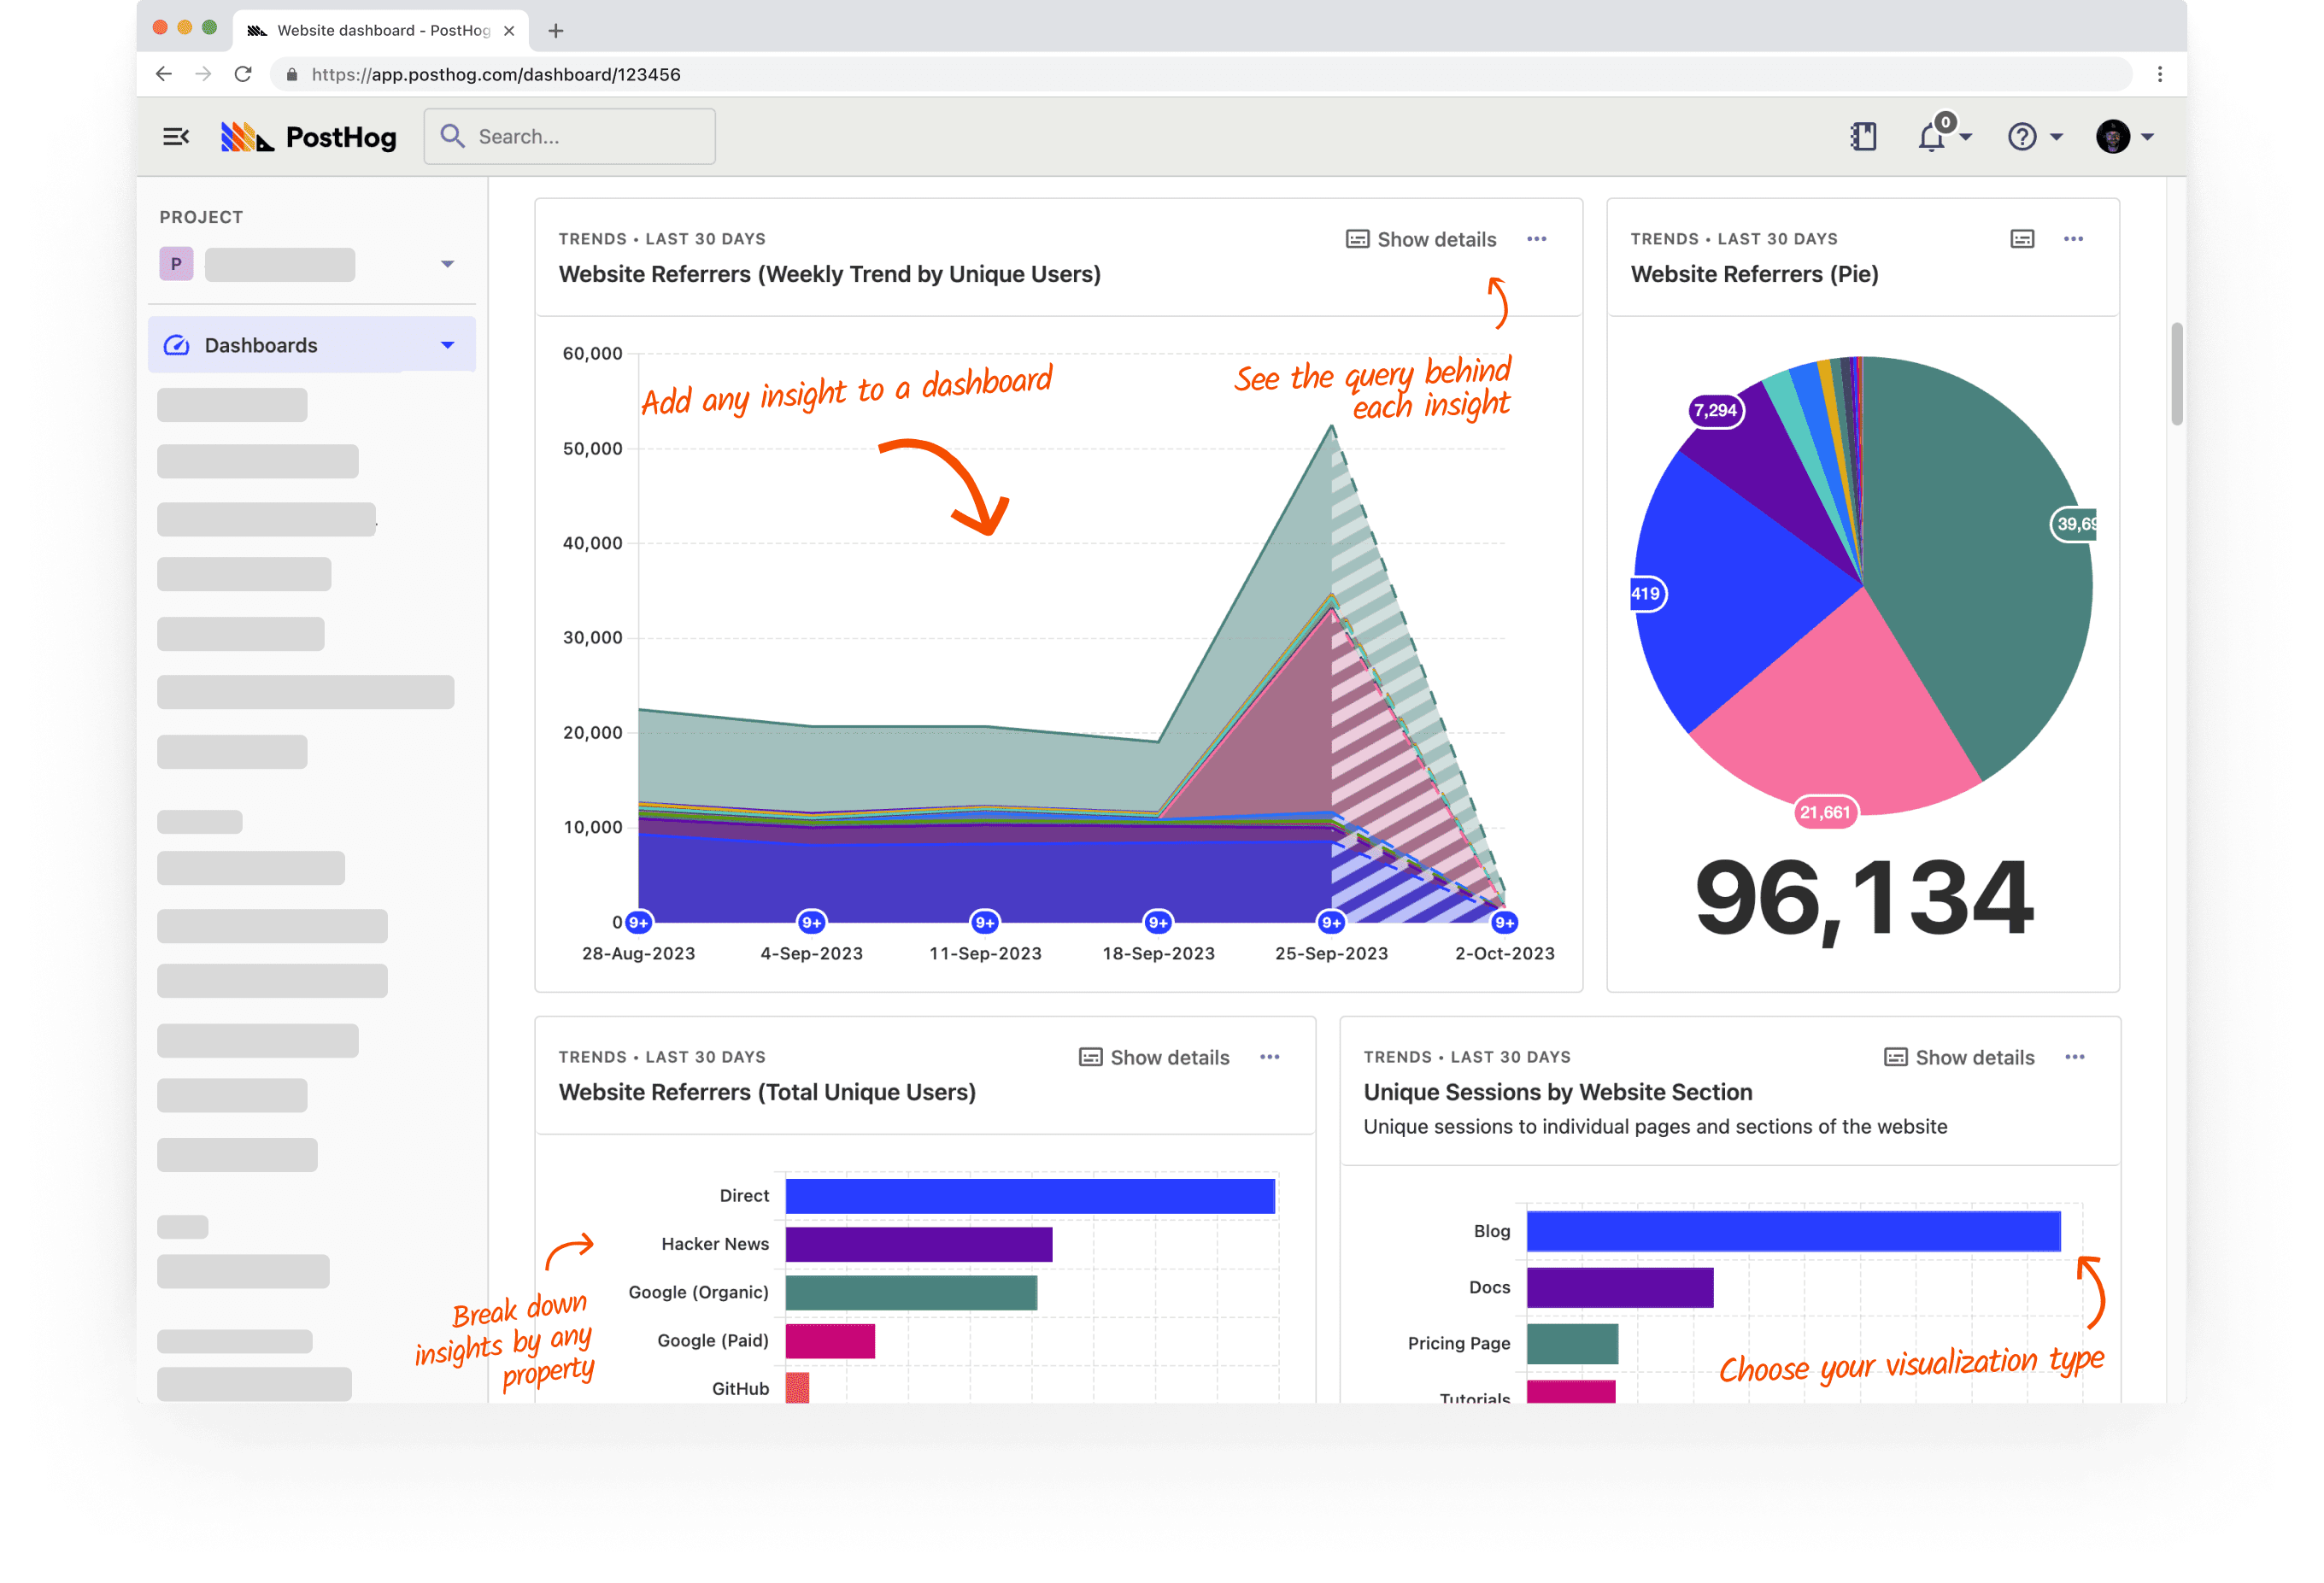
Product analytics with autocapture
PostHog is the only product analytics platform built to natively work with session replay, feature flags, experiments, and surveys.

gathers 30% more data than with Google Analytics
"We could autocapture... events using the JS snippet and... configure custom events."

improved conversion rates by 10-20%
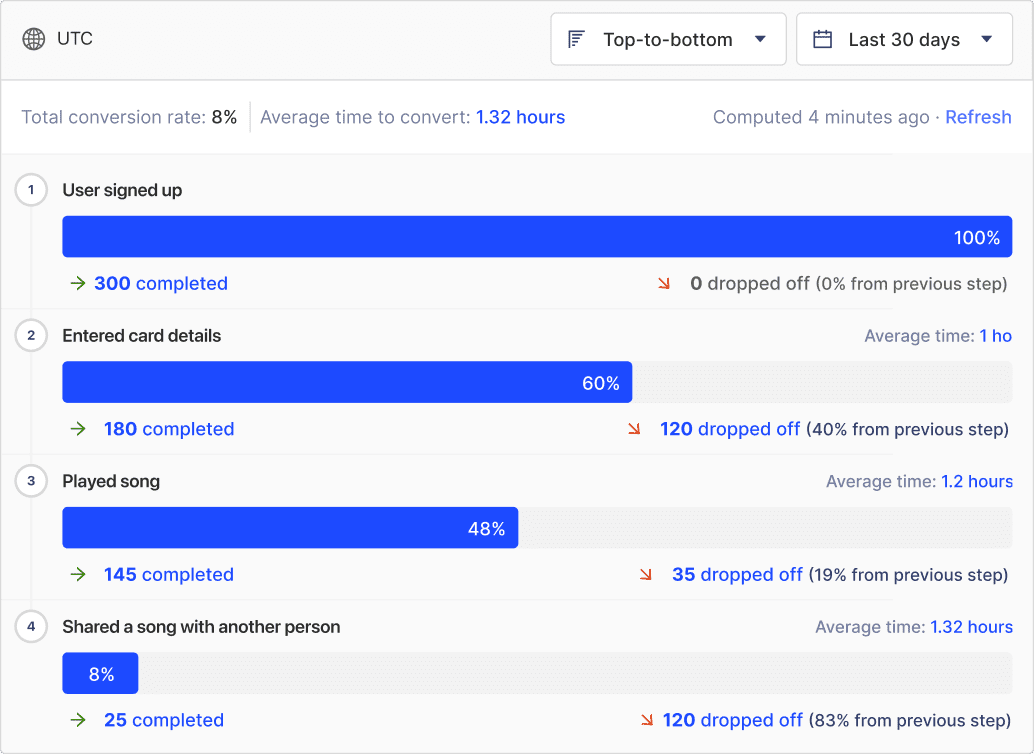
"we observed drop-offs at very particular stages of our onboarding flow."

increased registrations by 30%
"From [funnels], we could easily jump to session replays to see the drop-off point."

manages features and developer relations
"...top-to-bottom view of conversion rates and user paths, without... extra setup time."
Features
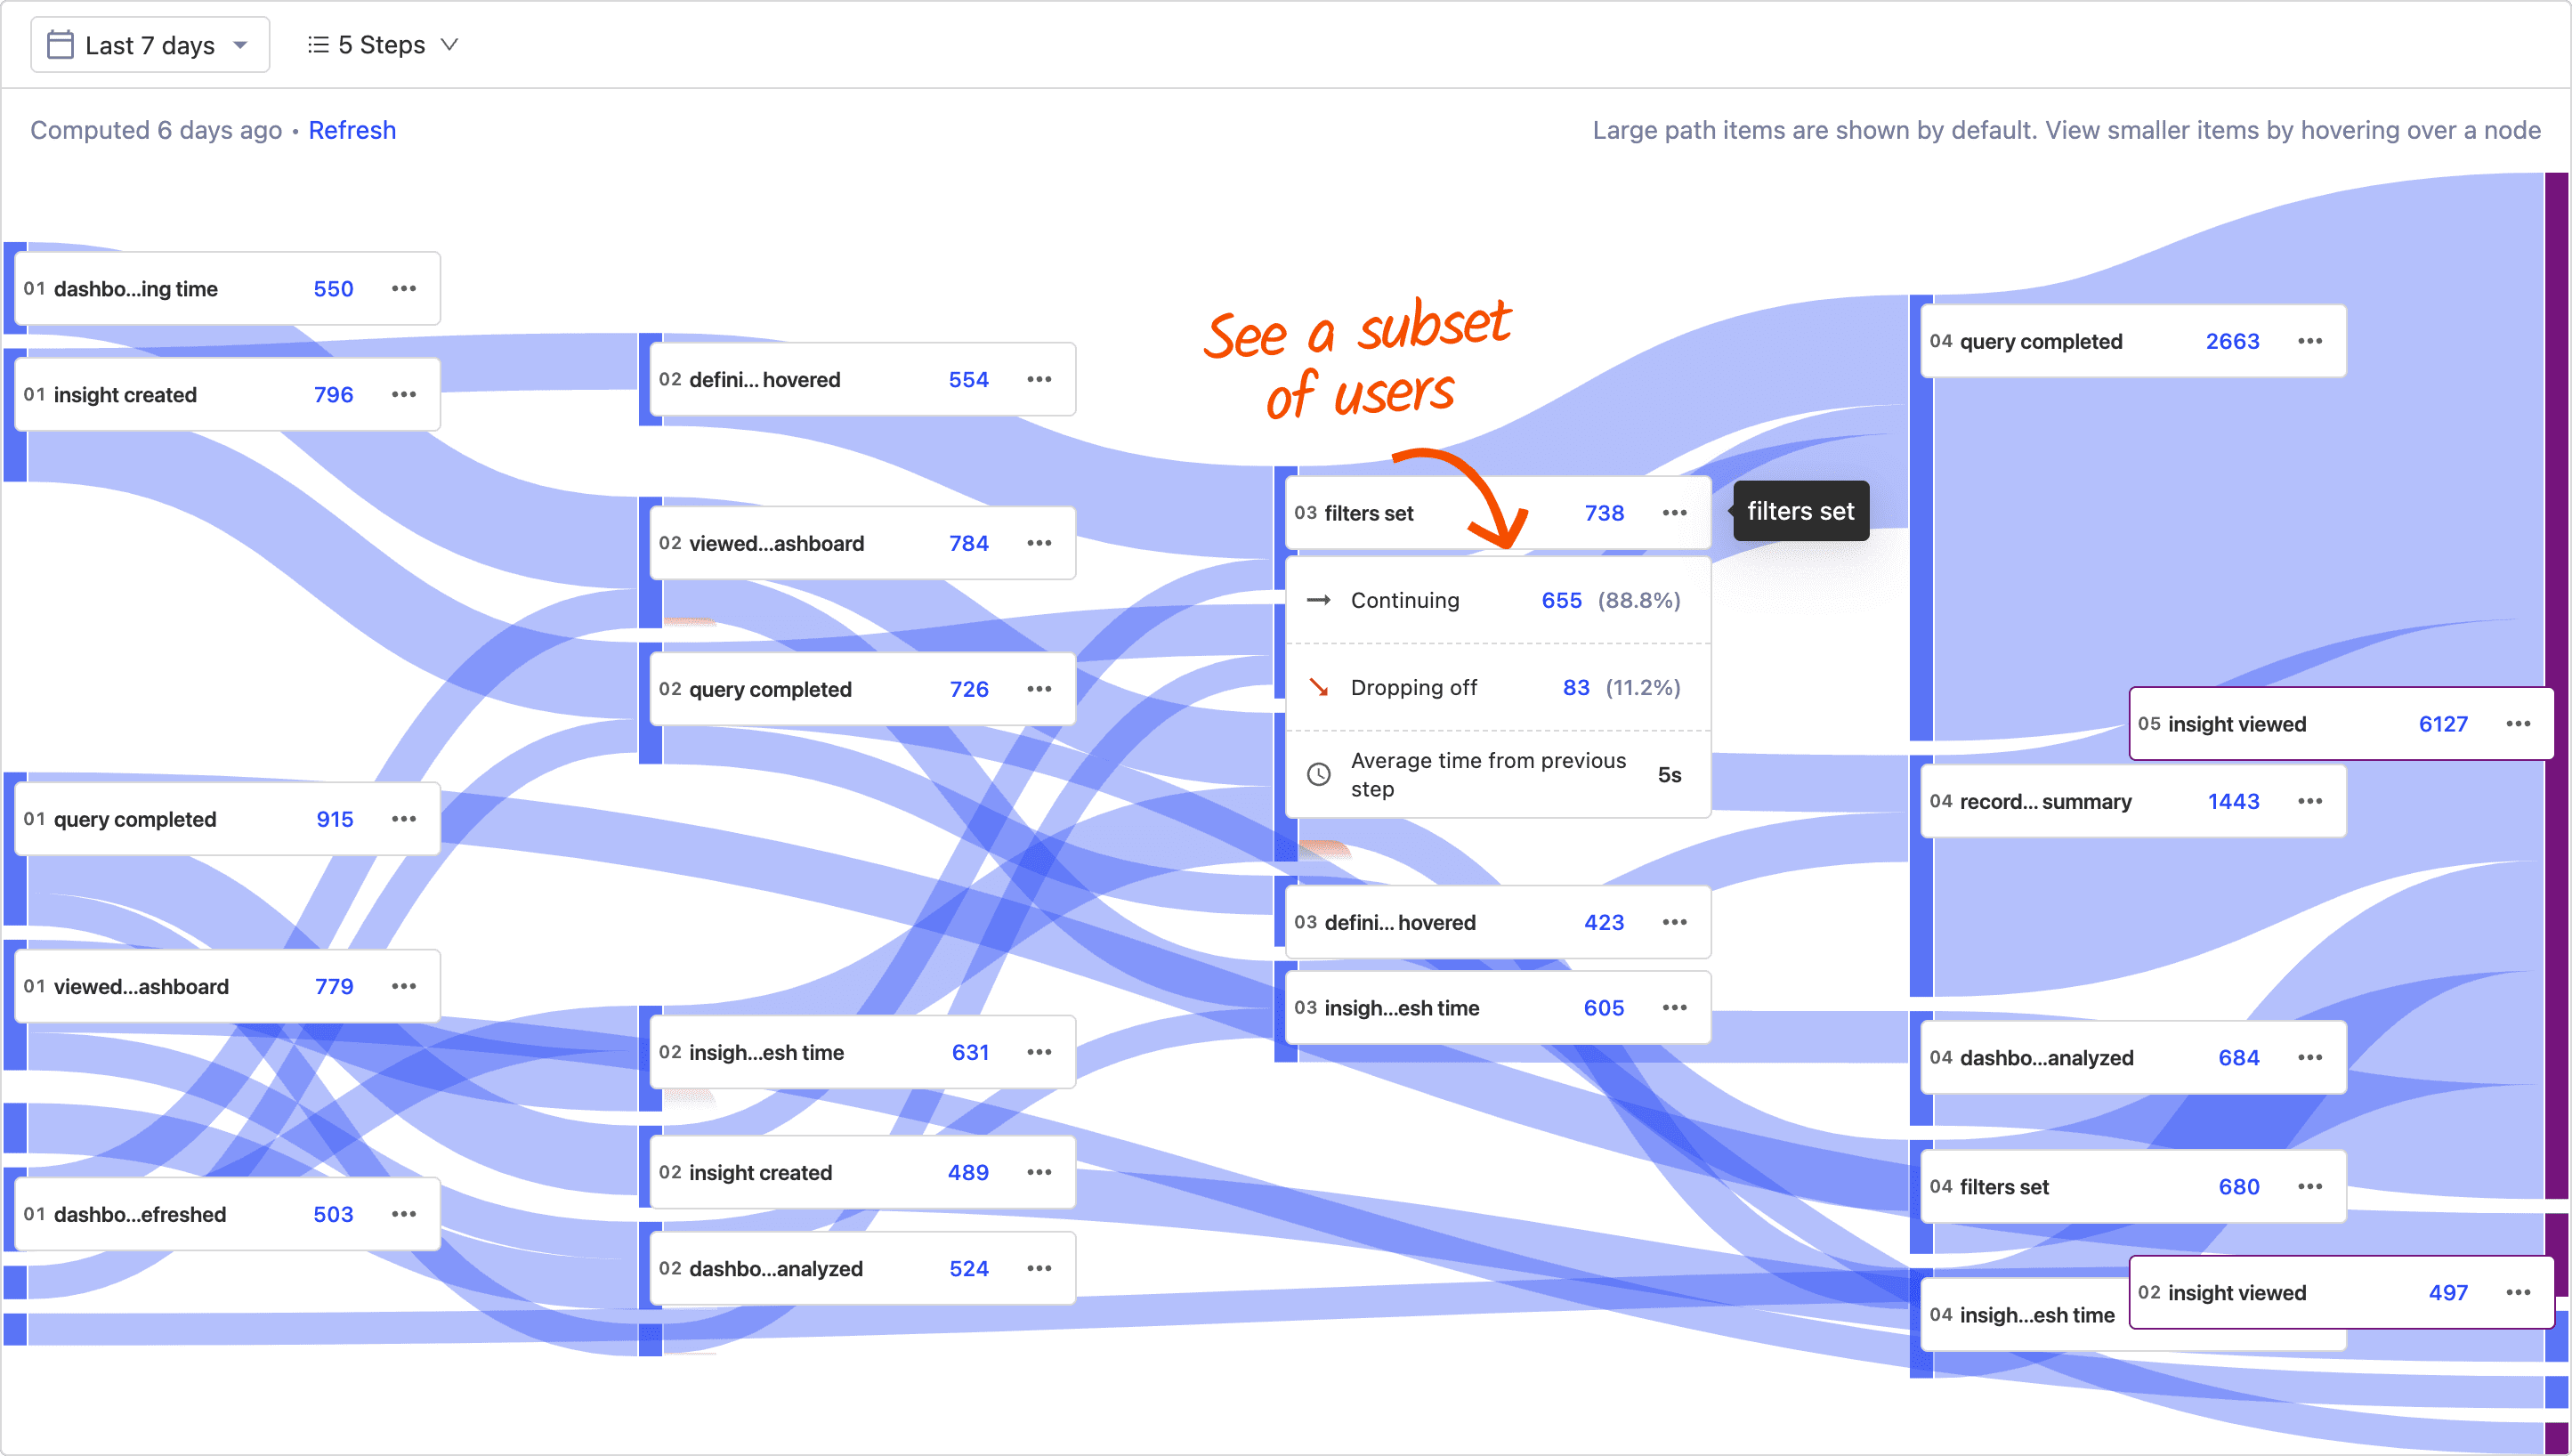
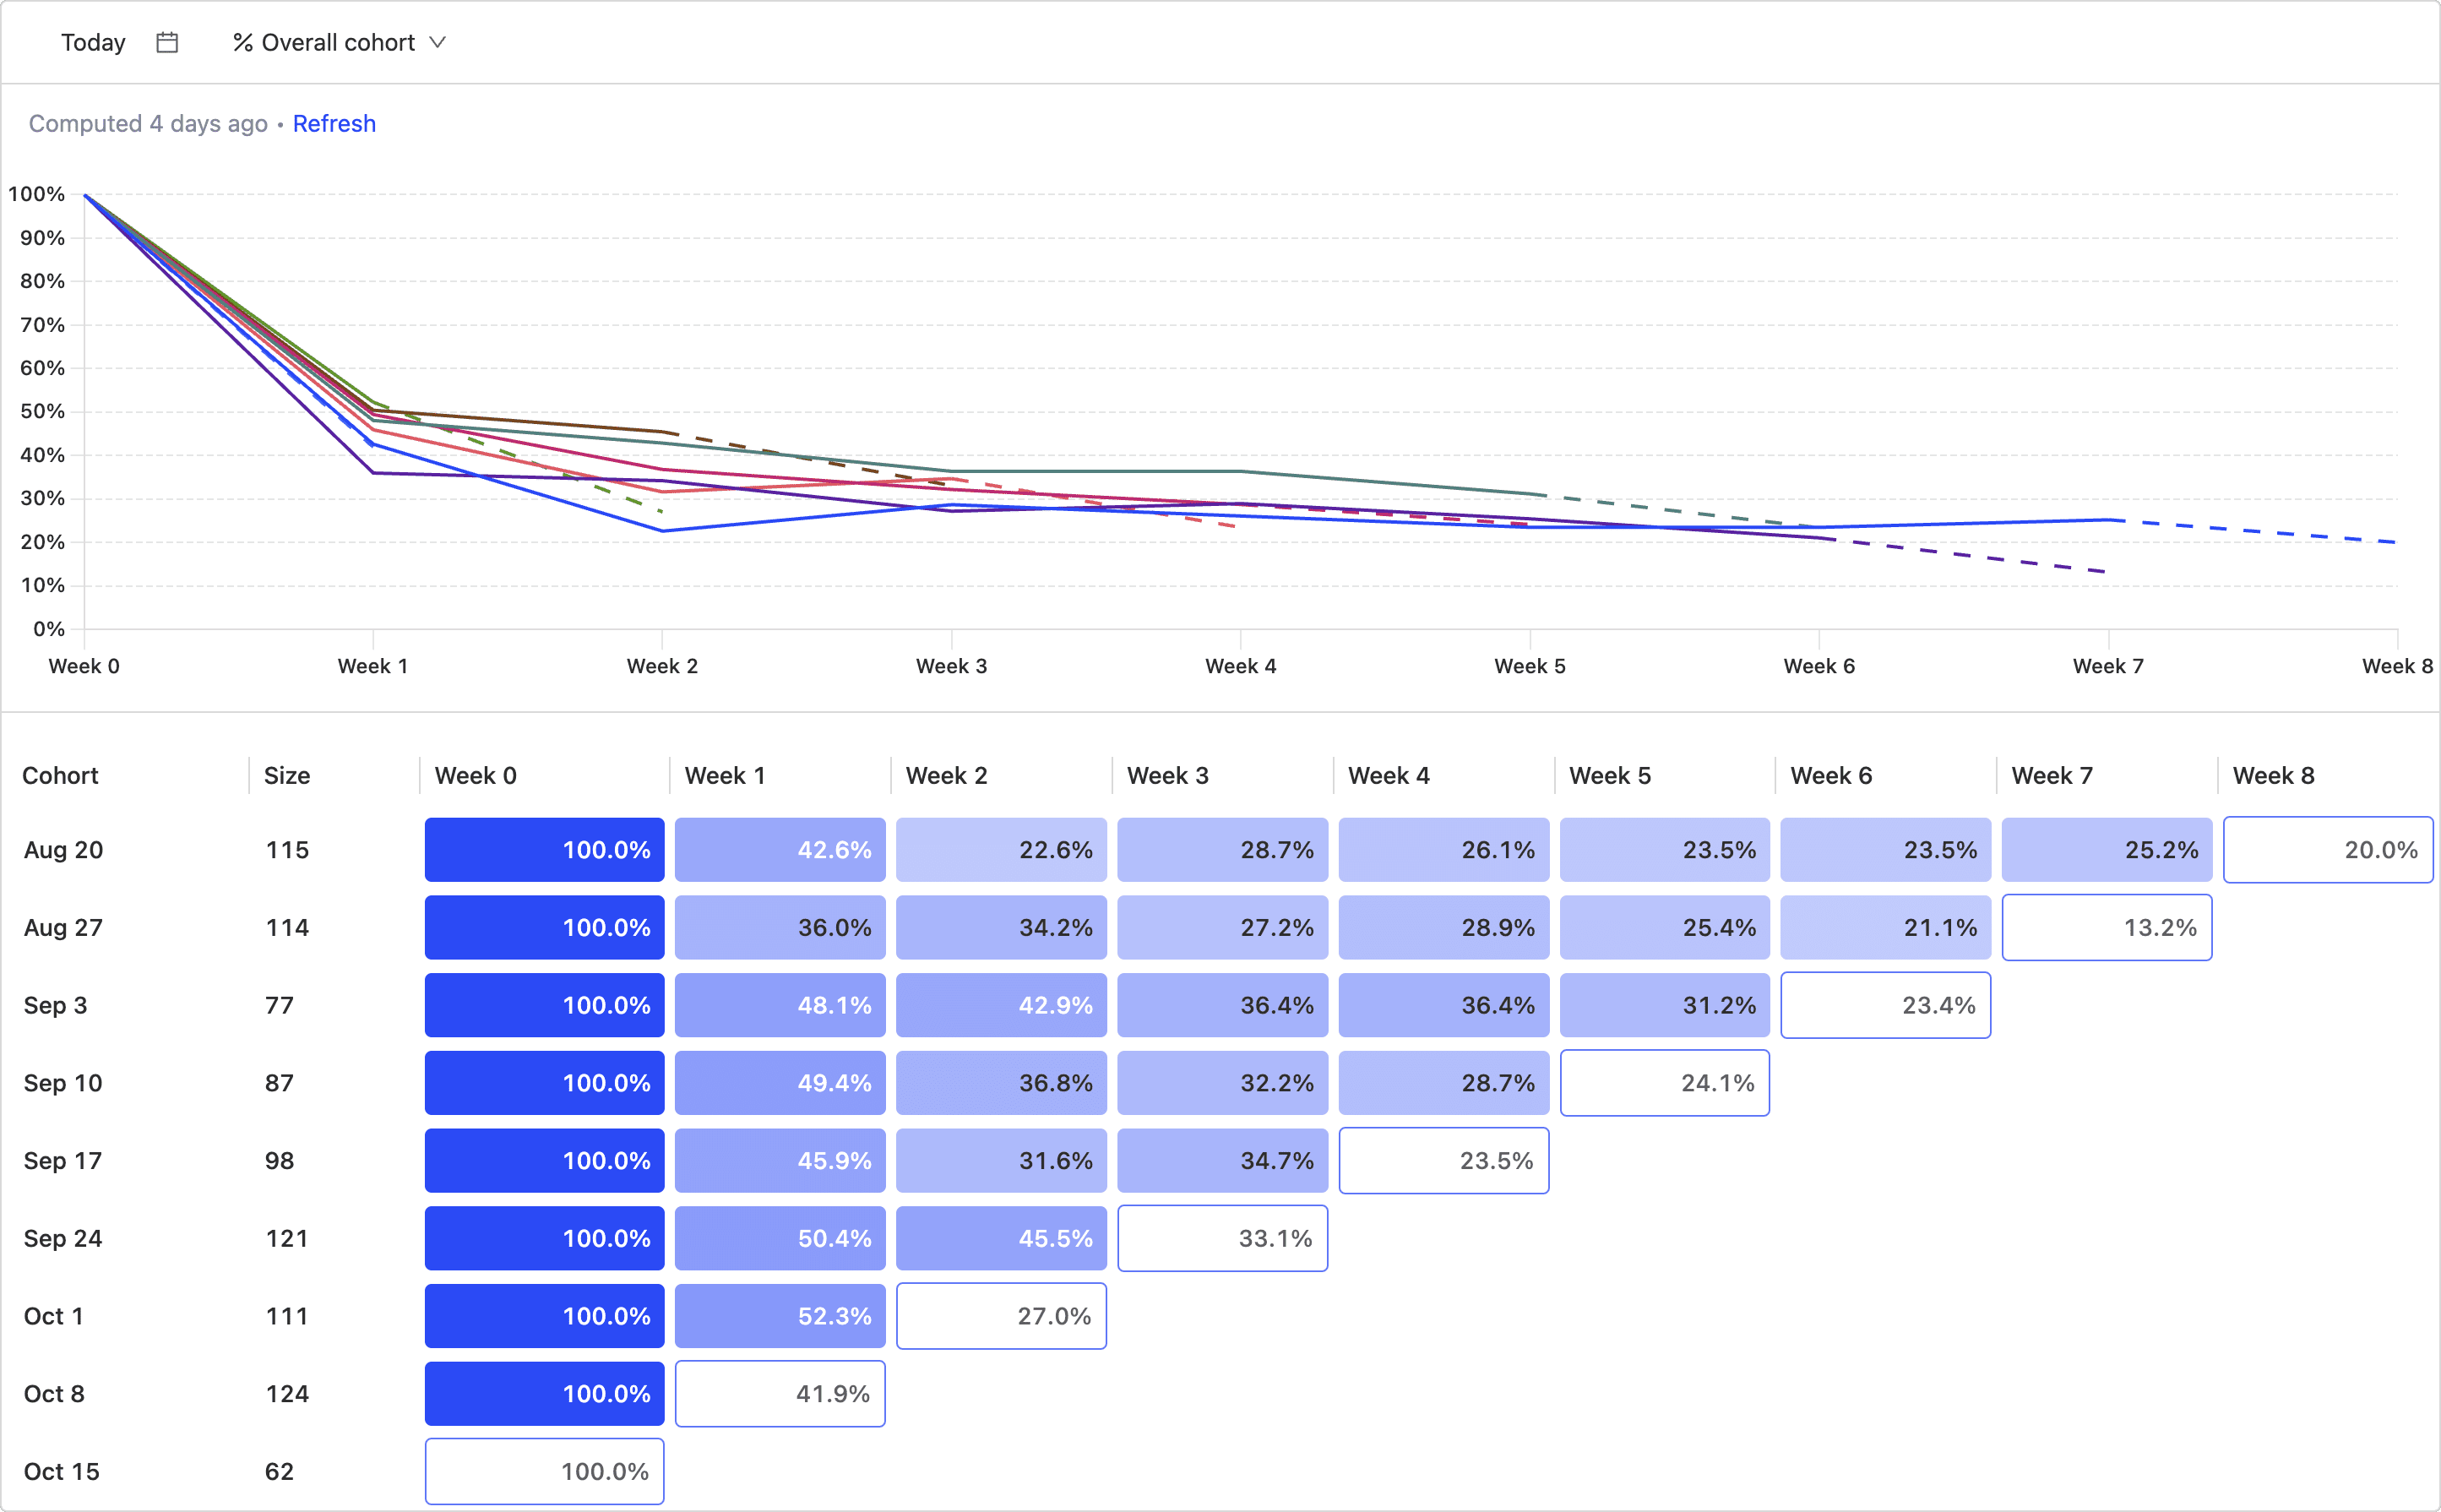
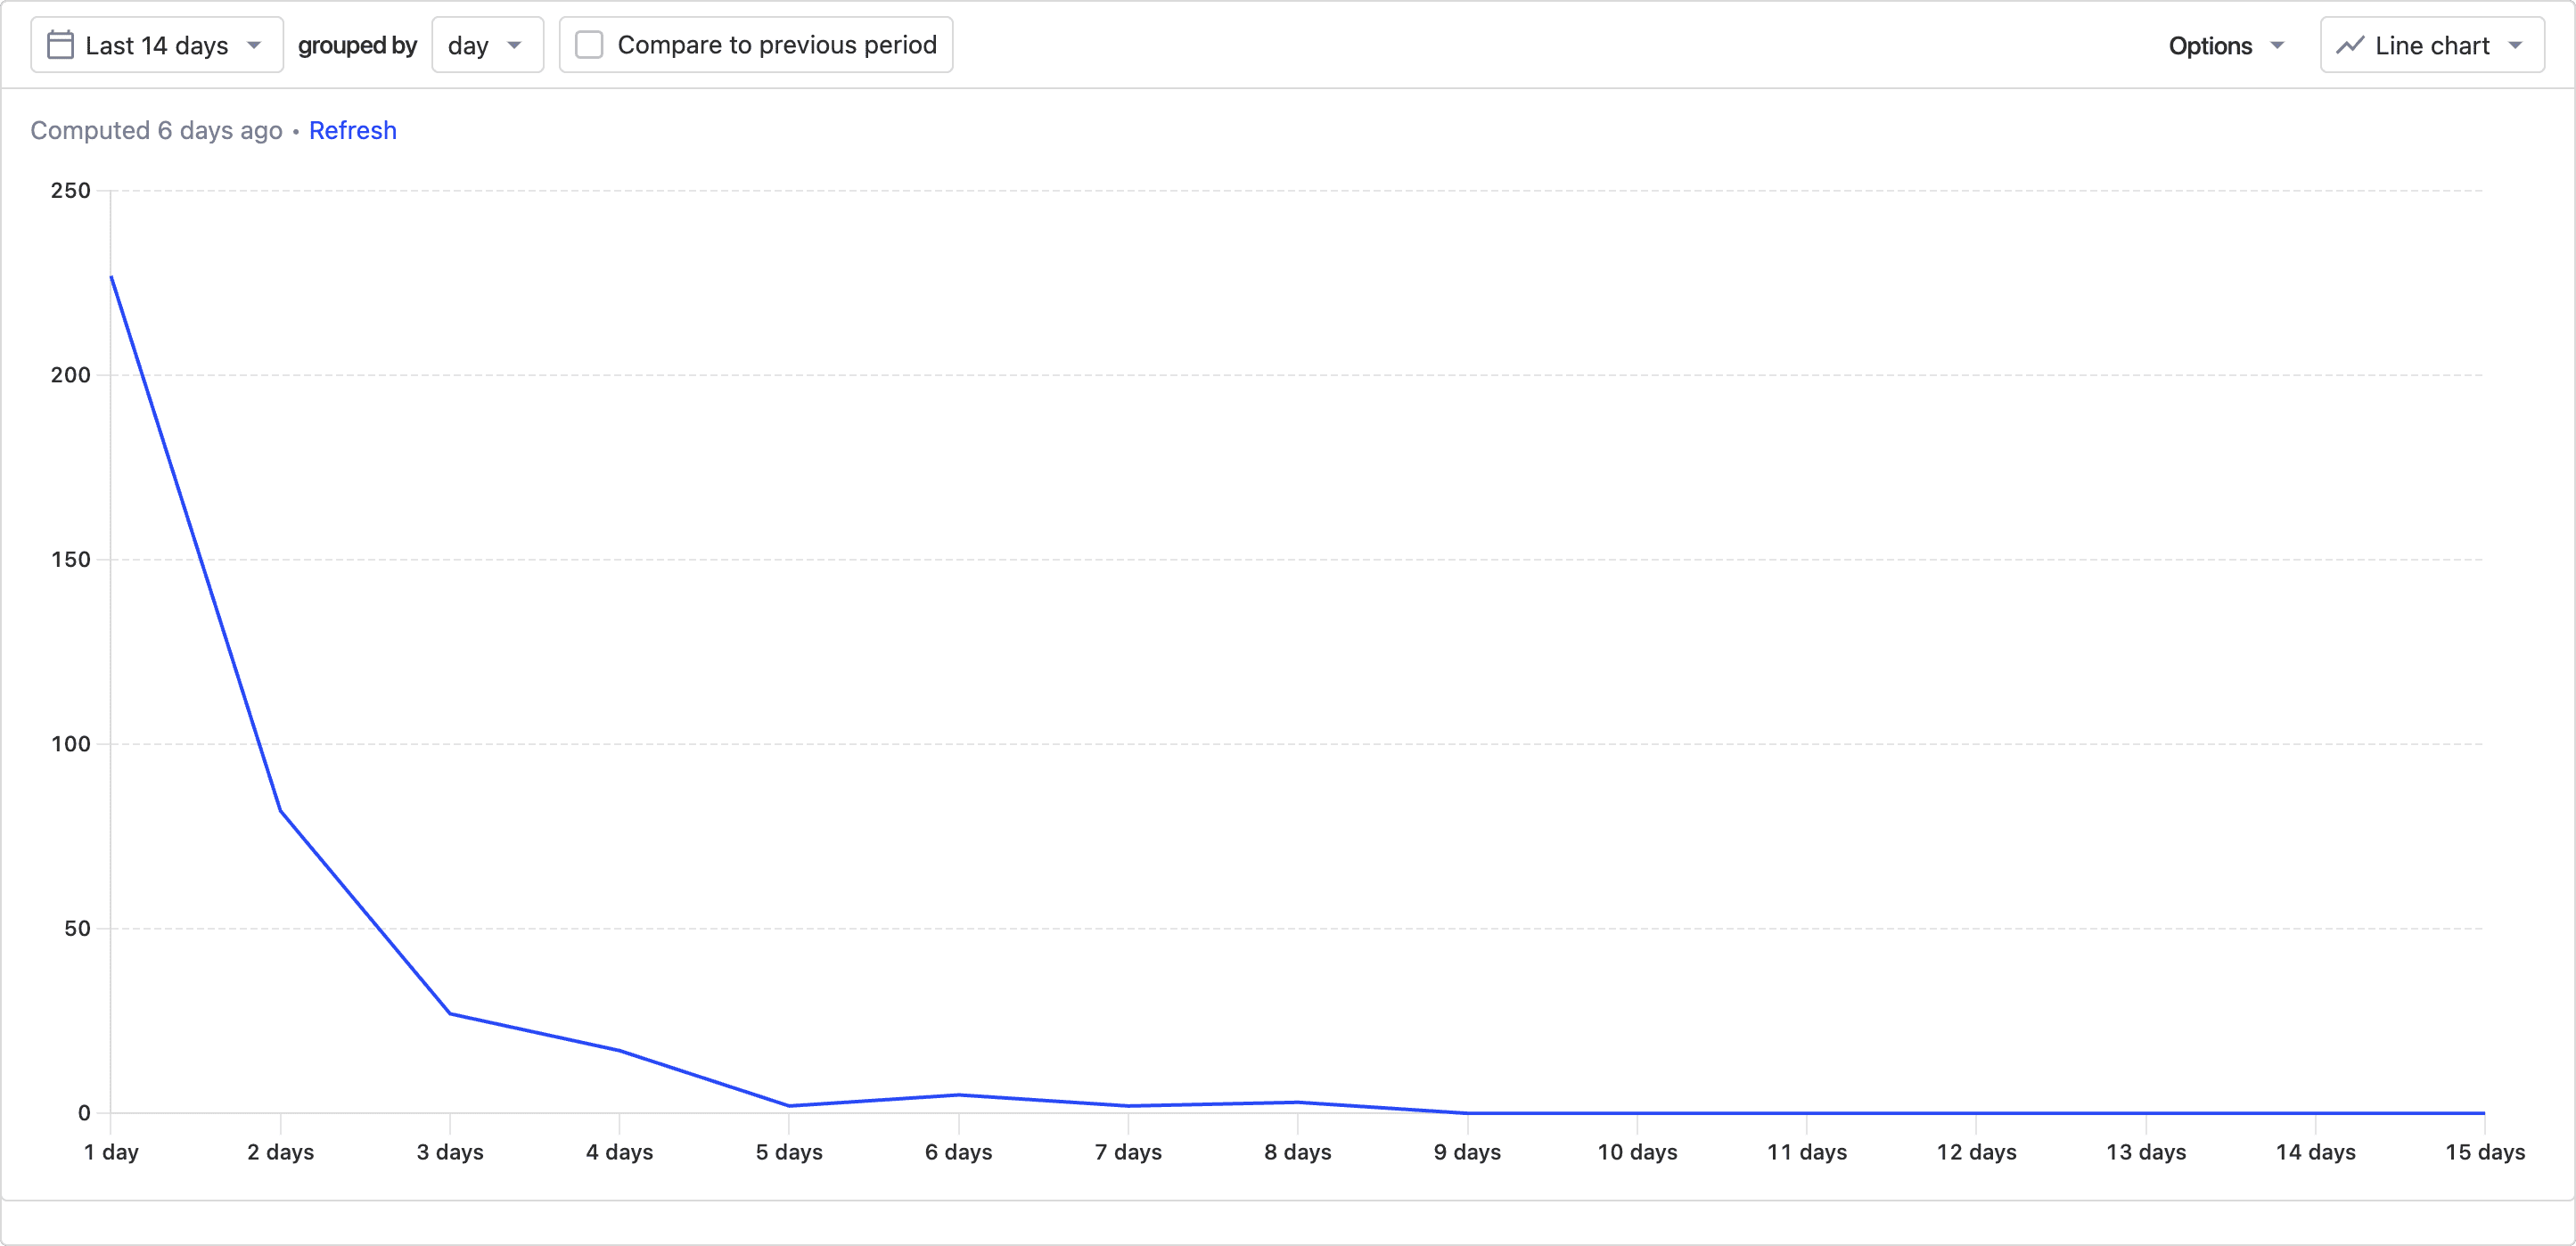
Find drop-off across a series of actions
Filtering
Set filters for individual steps – or the entire funnel – by person property, group or cohort, or event property
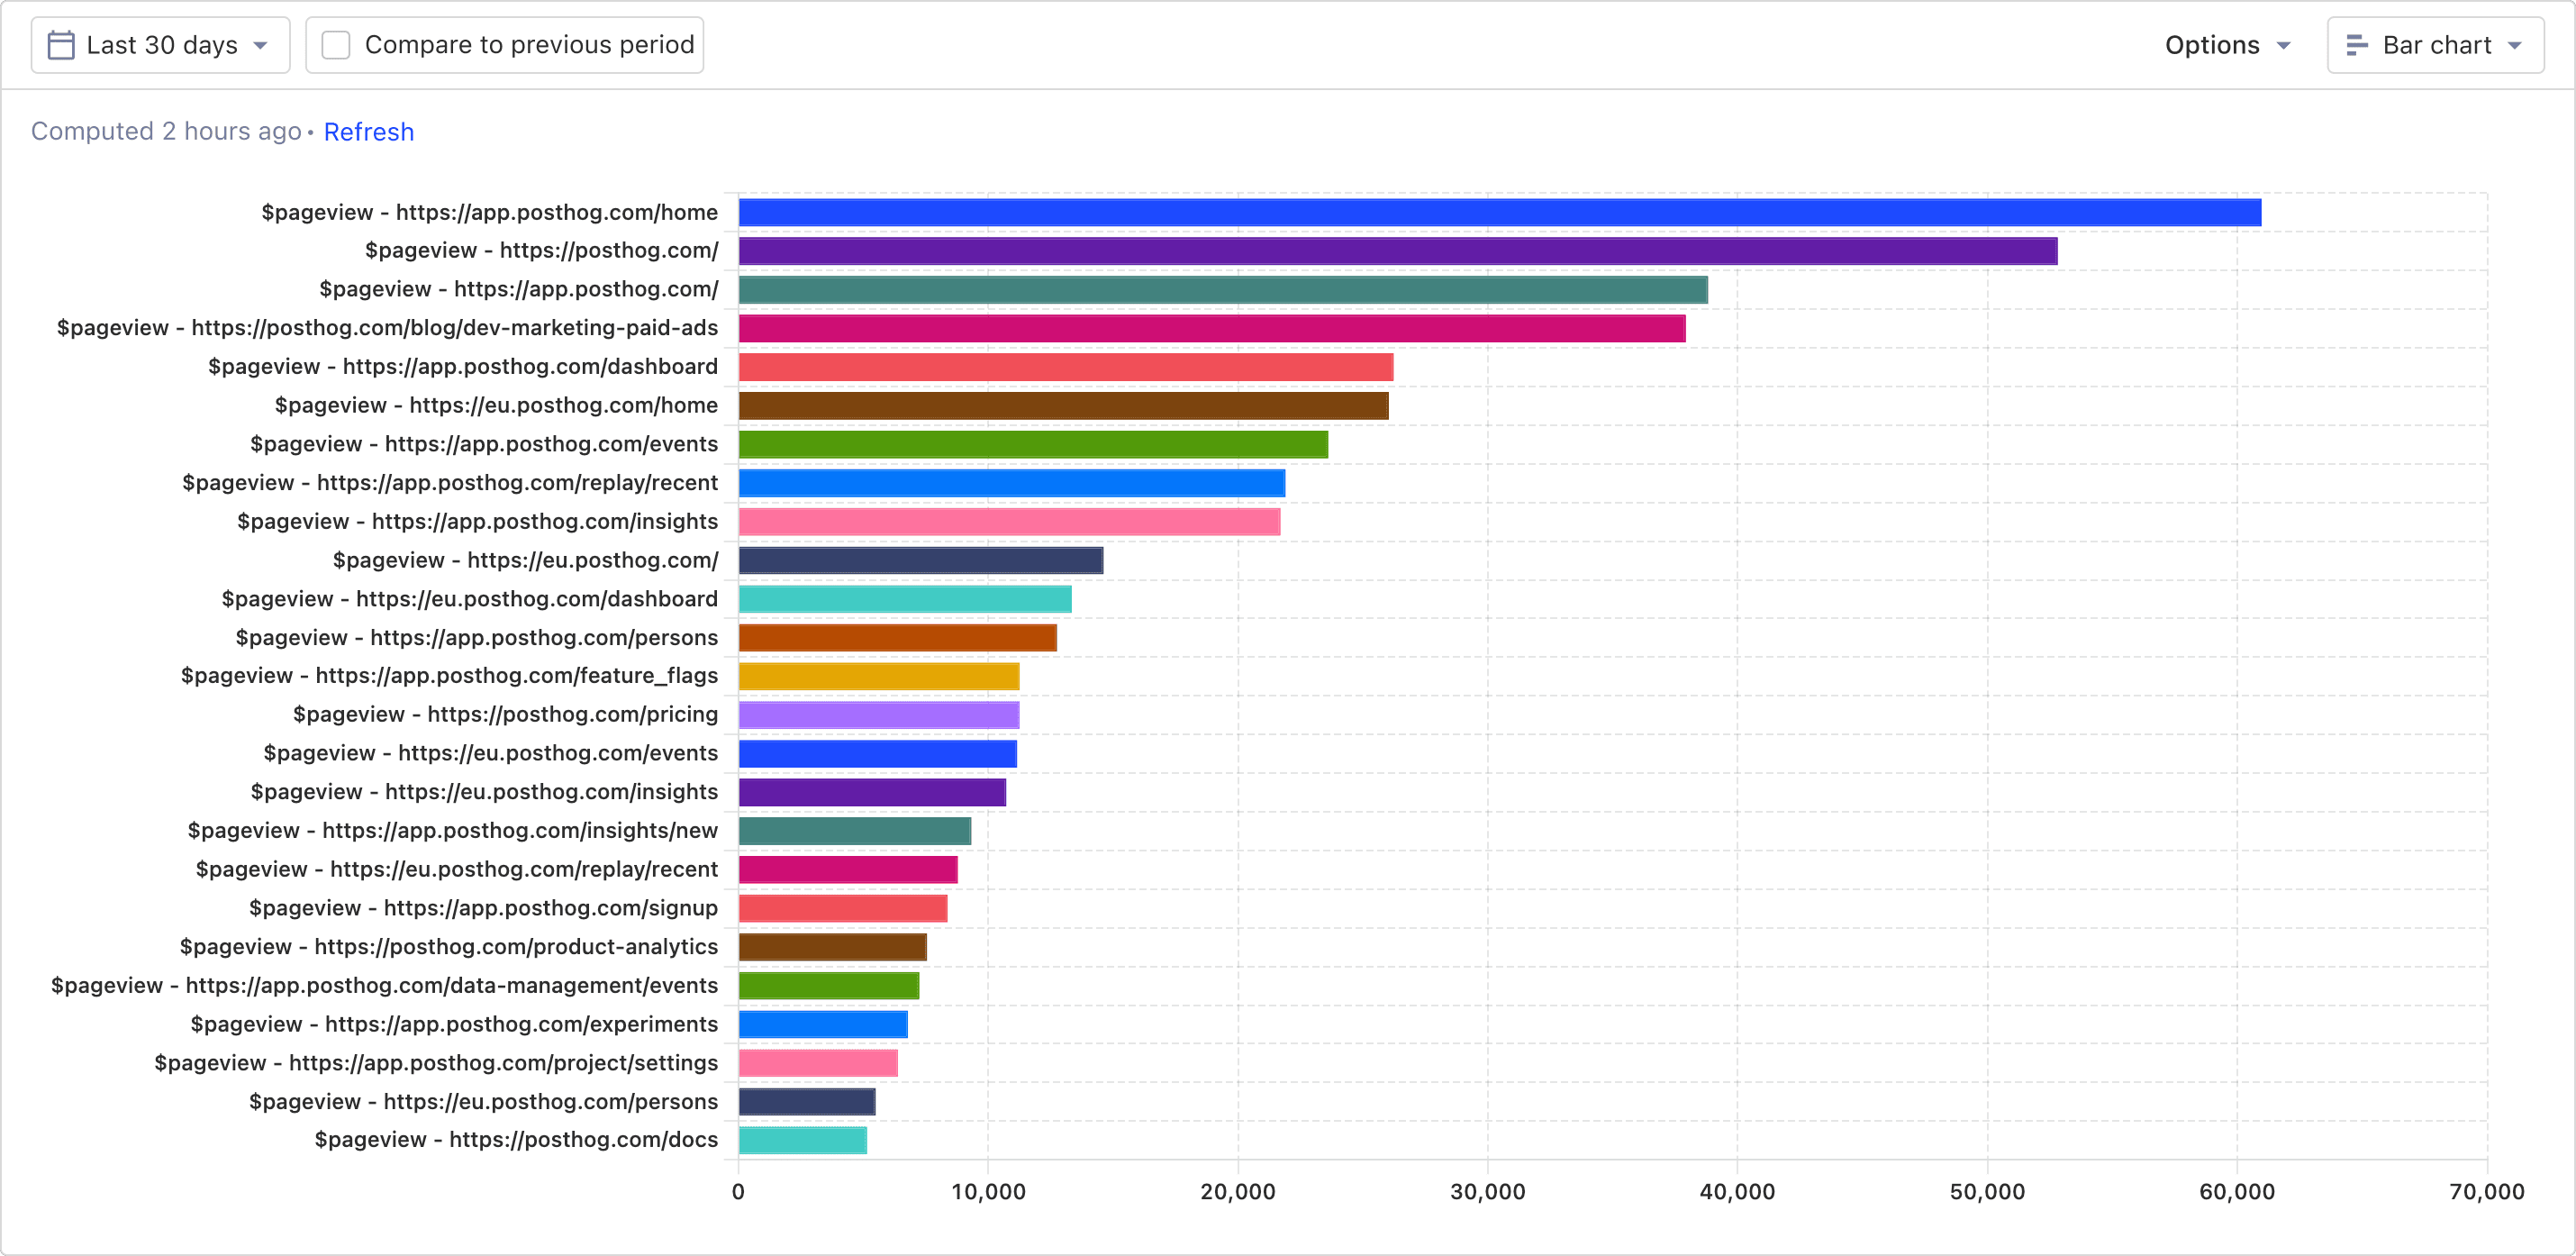
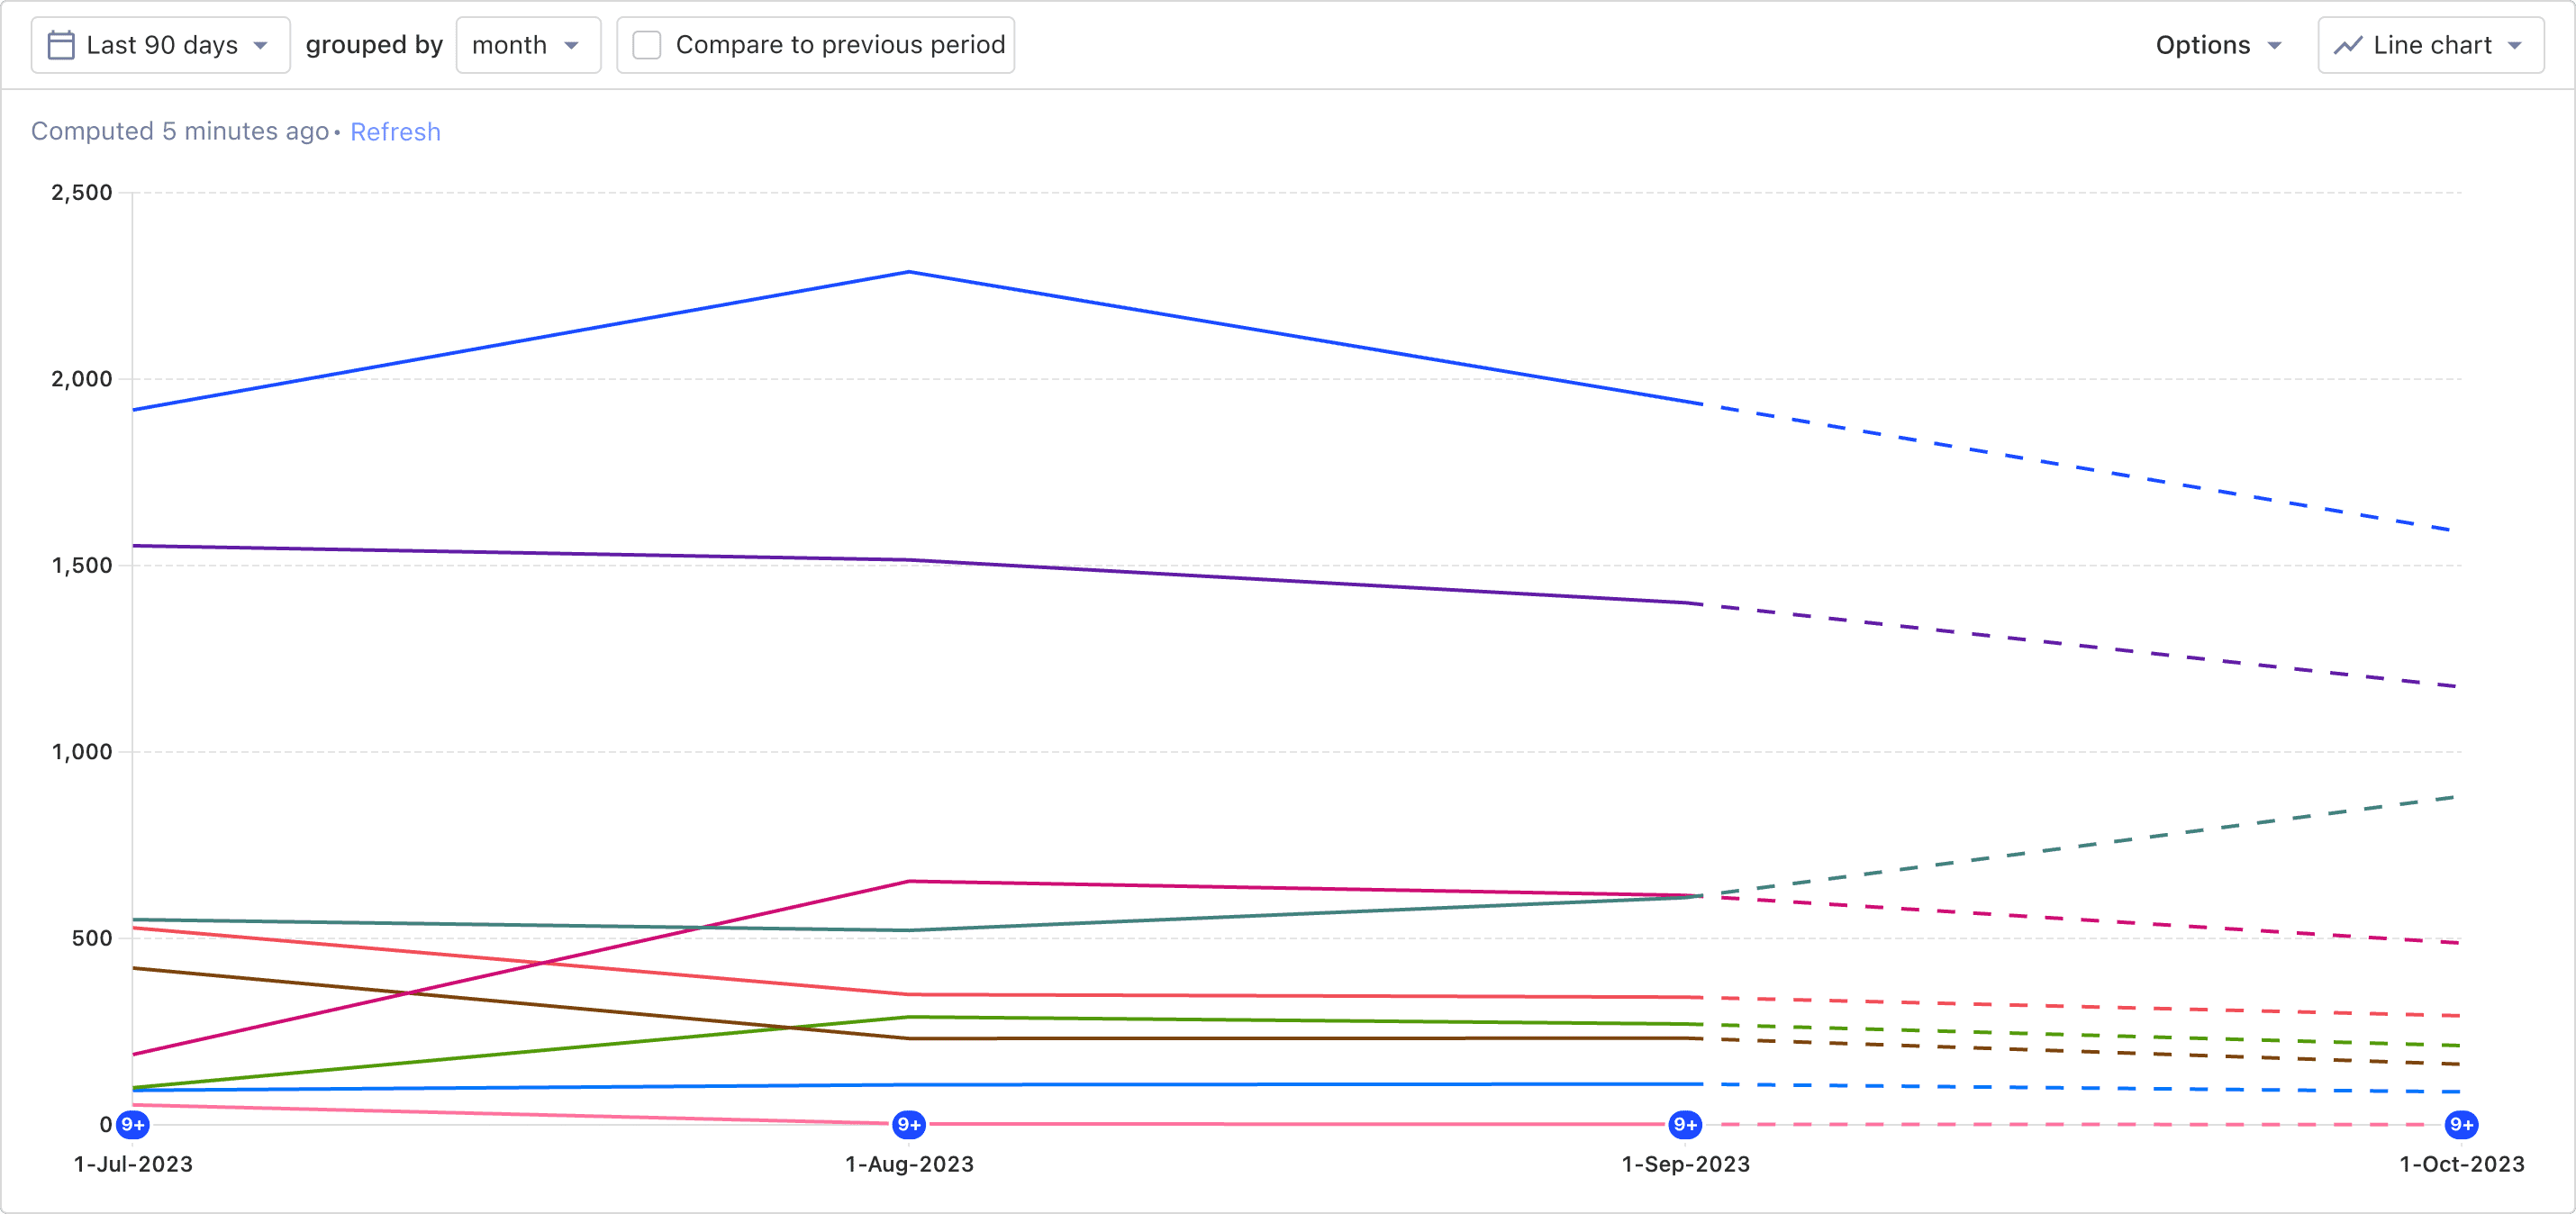
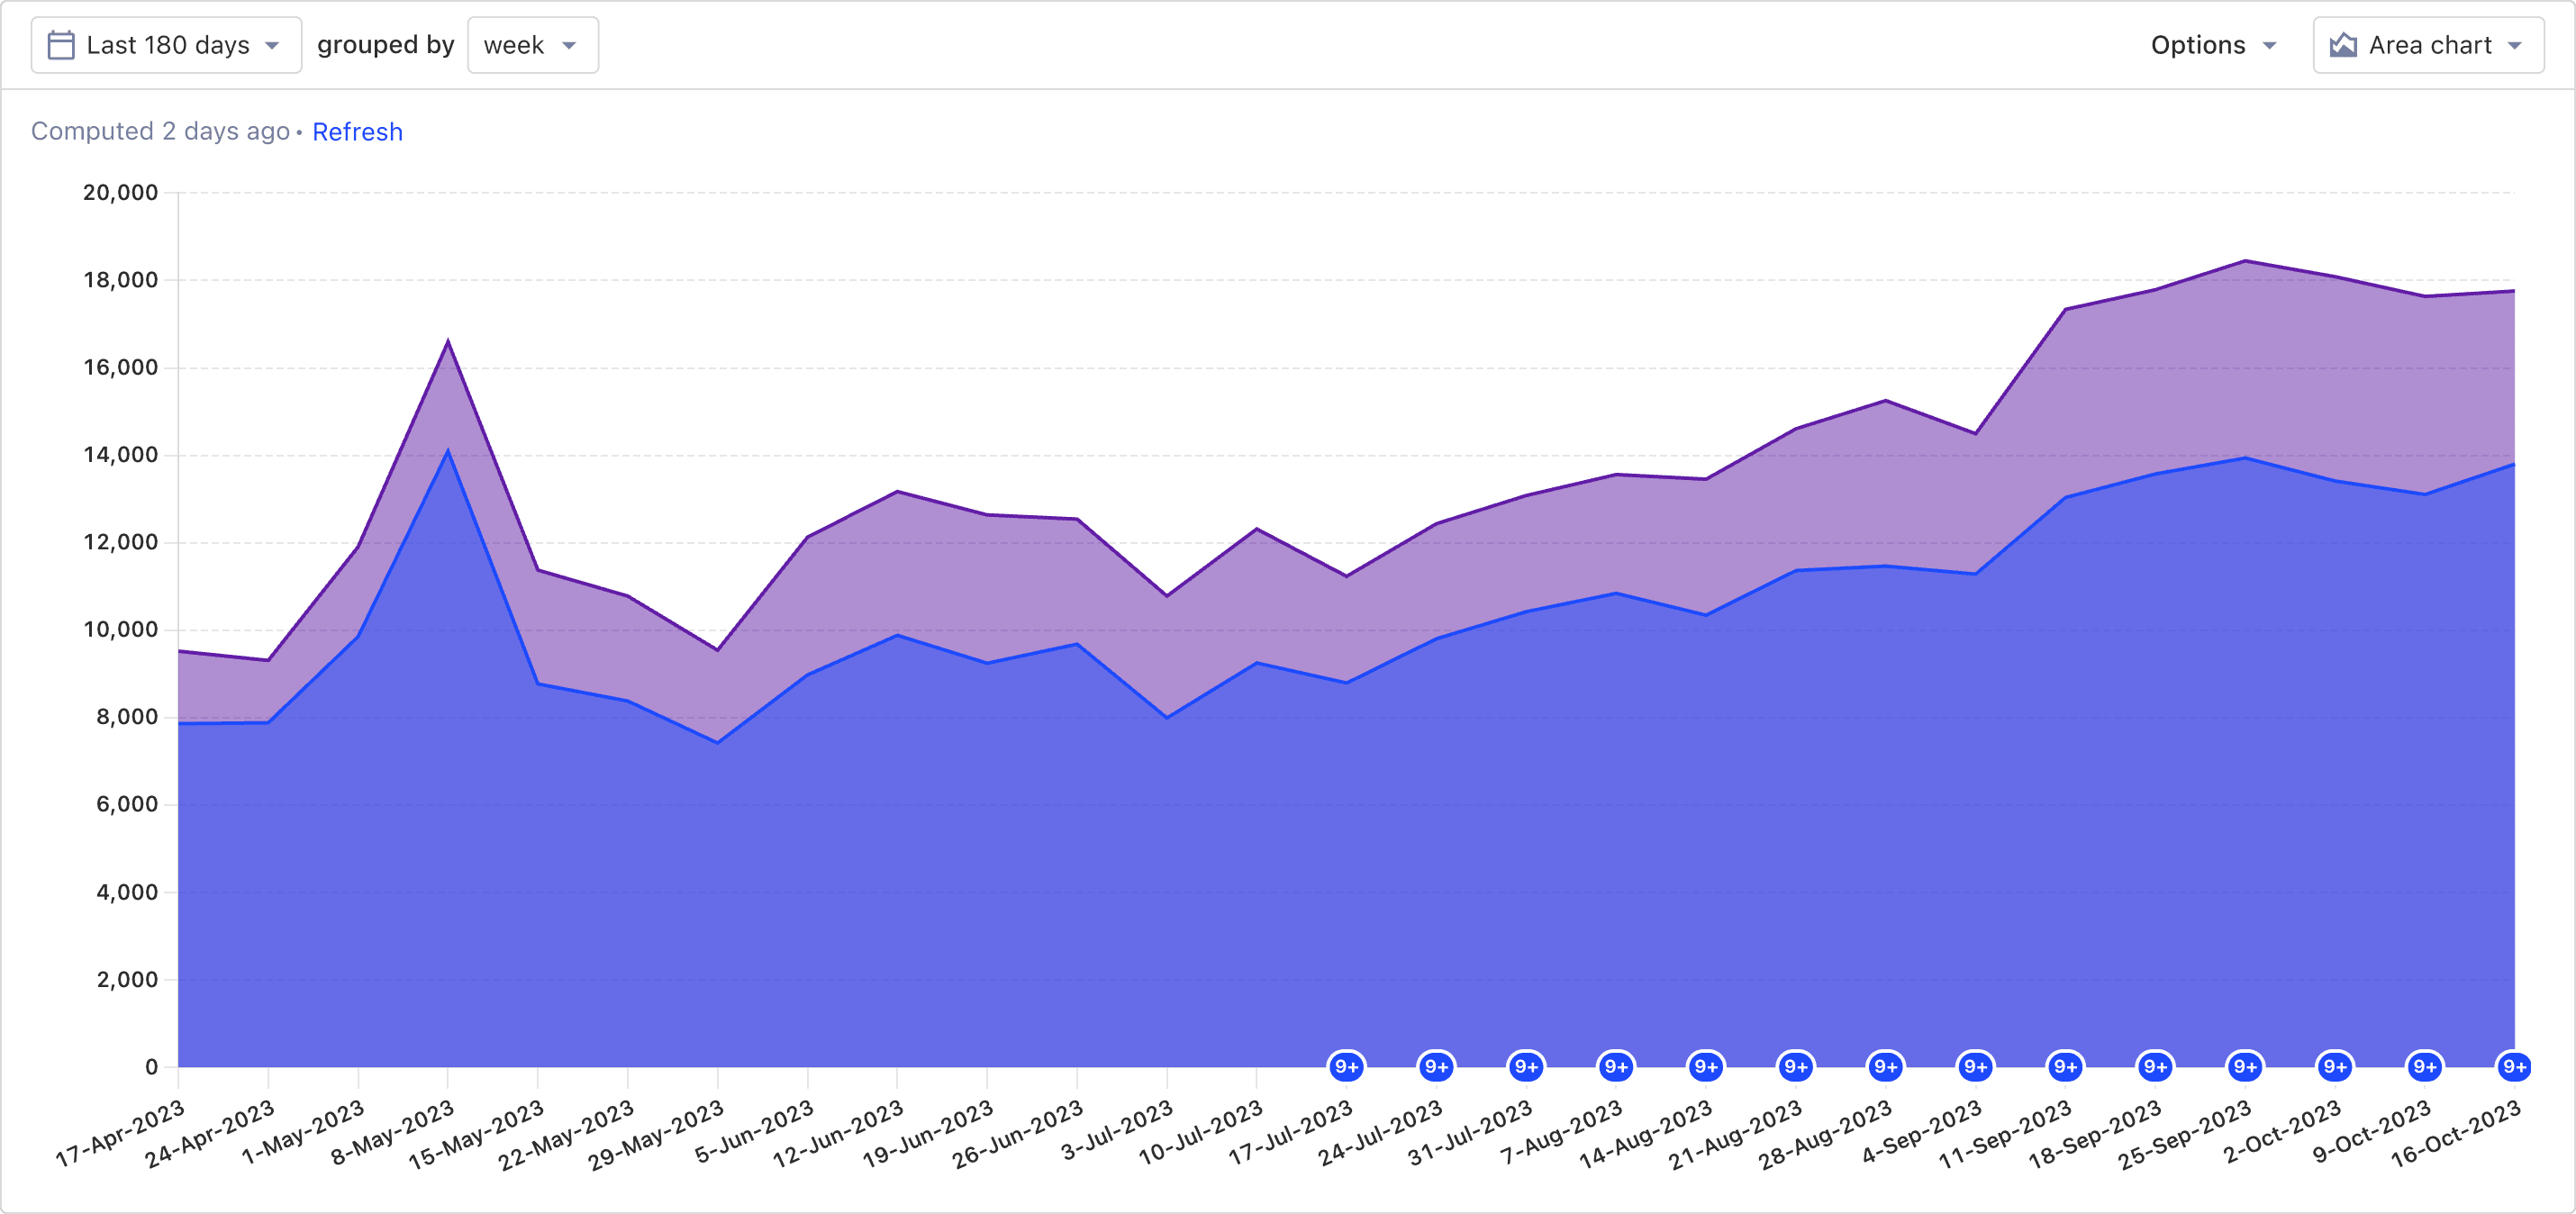
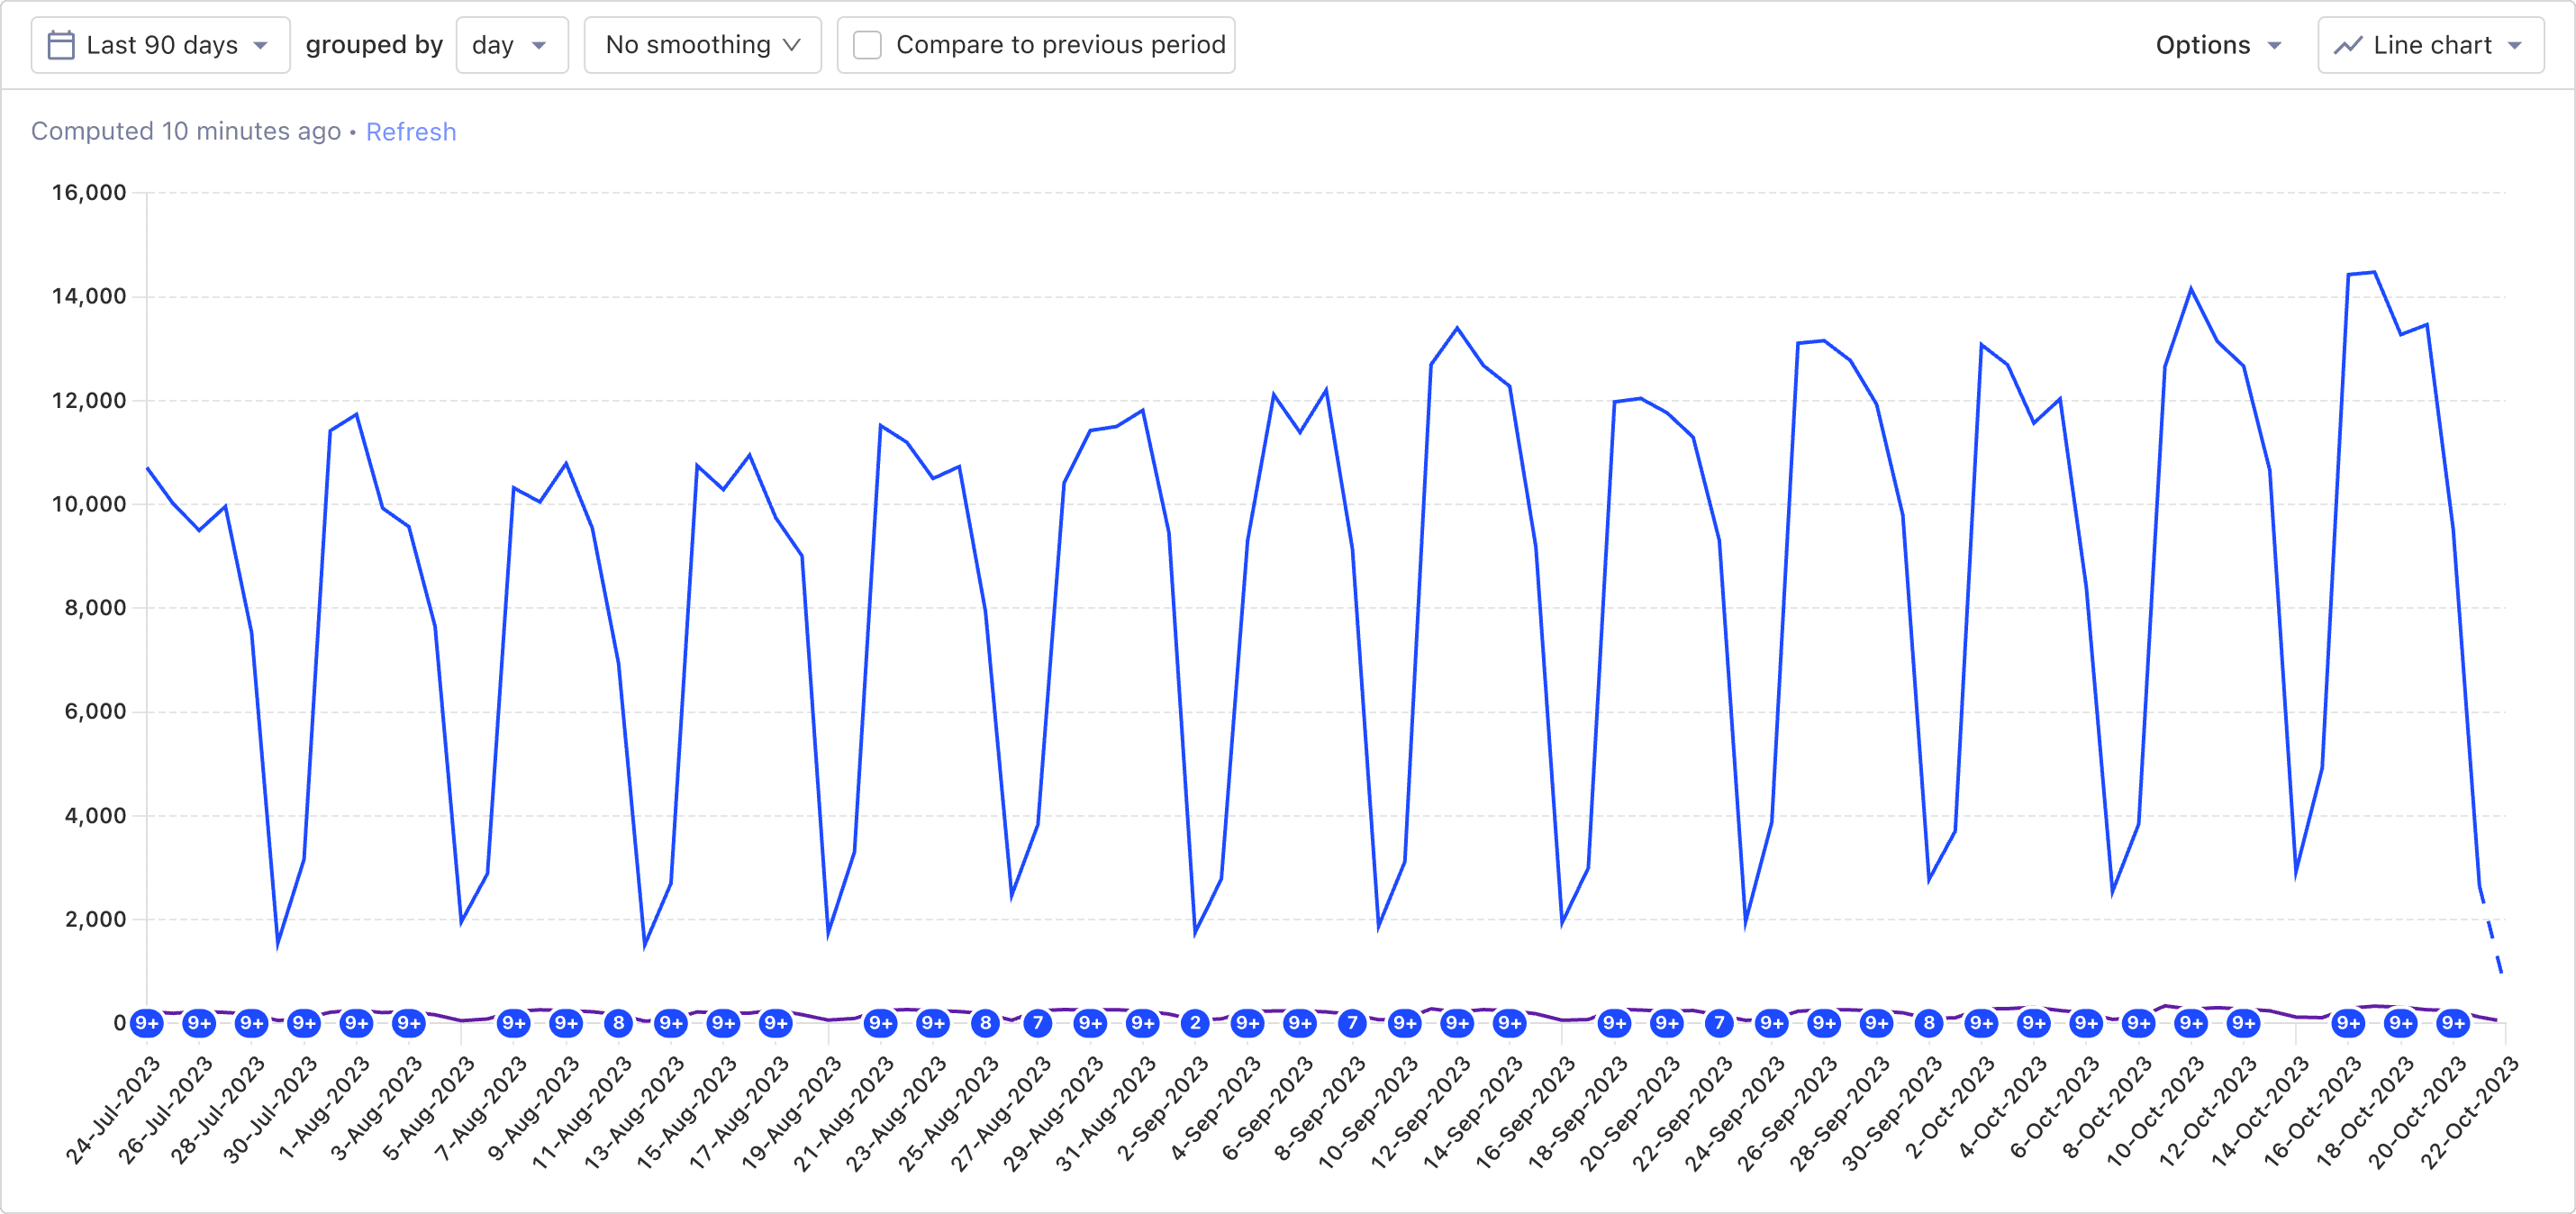
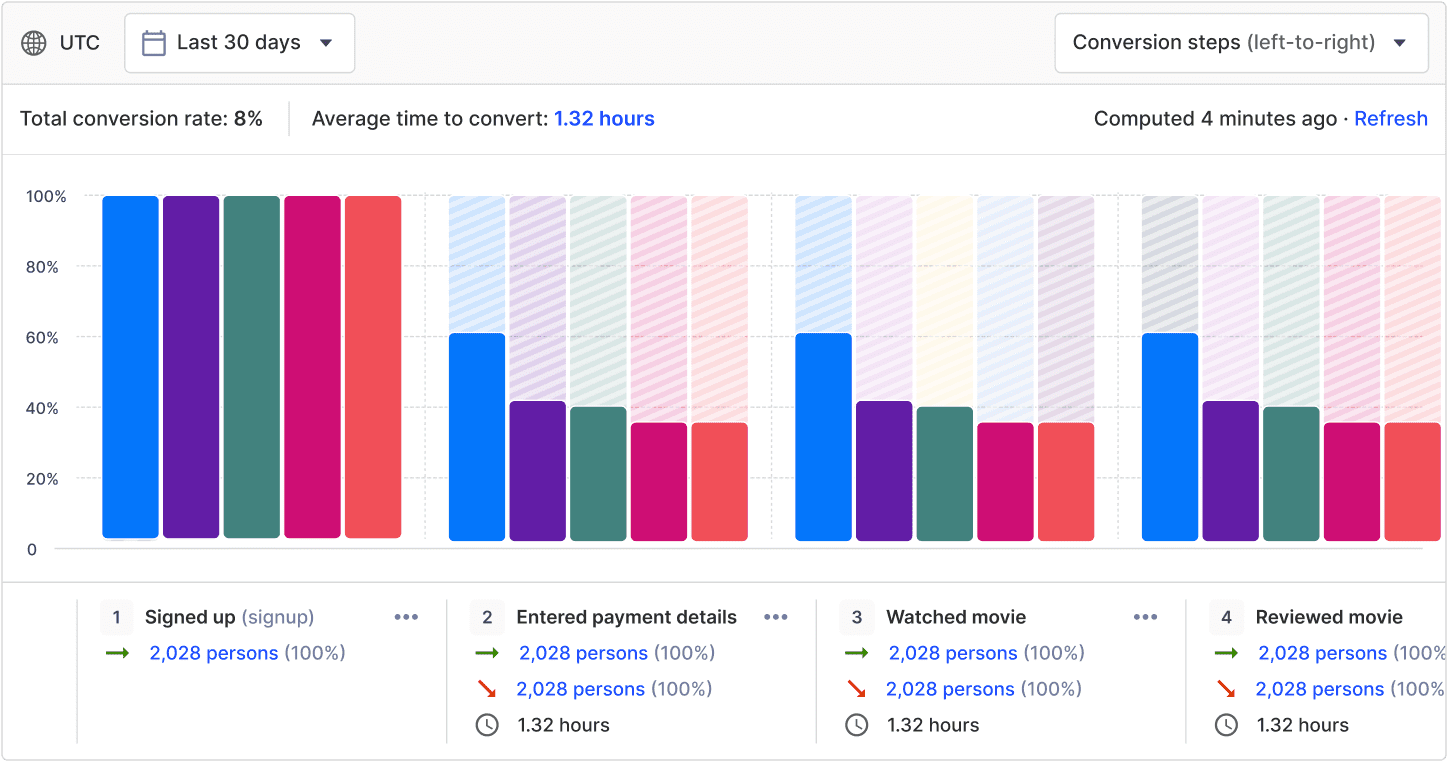
Graph types
Track user progression between steps, conversion time between each step, and how a funnel’s conversion rate changes over time
Step ordering
Choose between a sequential series of steps, a strict order, or any order of steps that lead to conversion
Granular controls
Set conversion window limit, add exclusionary steps, set attribution type, and see the relative conversion rate between each step
Autocapture
Add PostHog.js to your website or web app to track all event data and retroactively define eventsData visualization
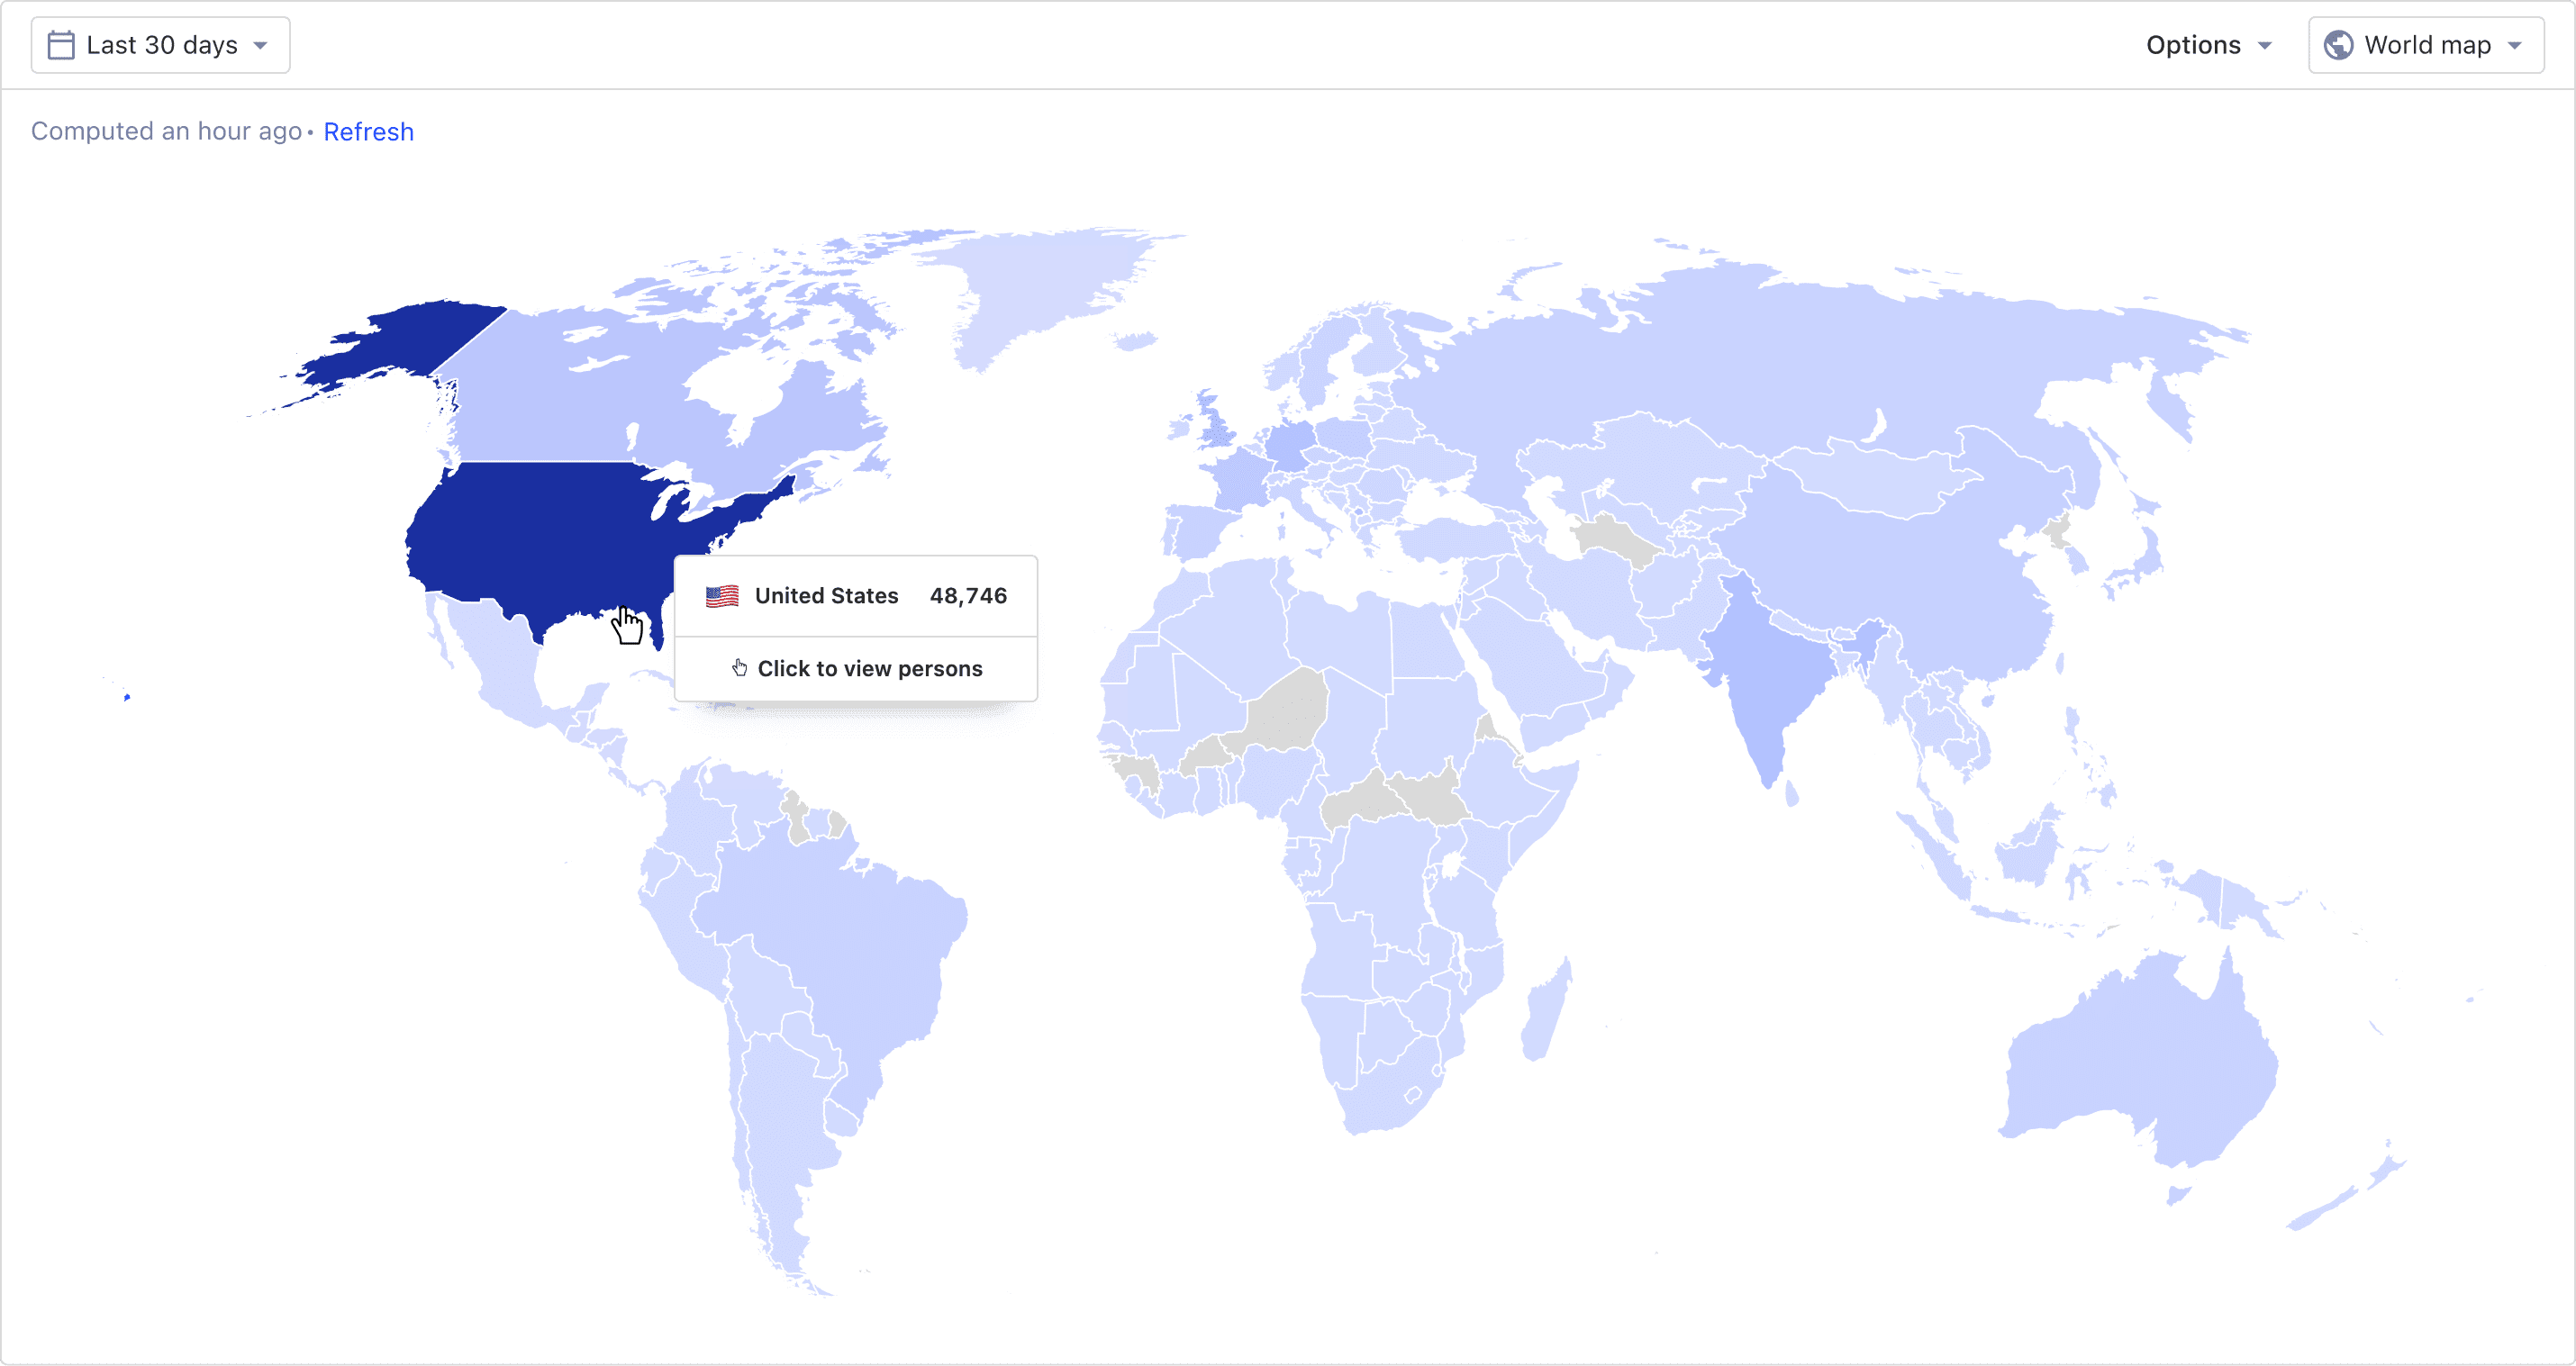
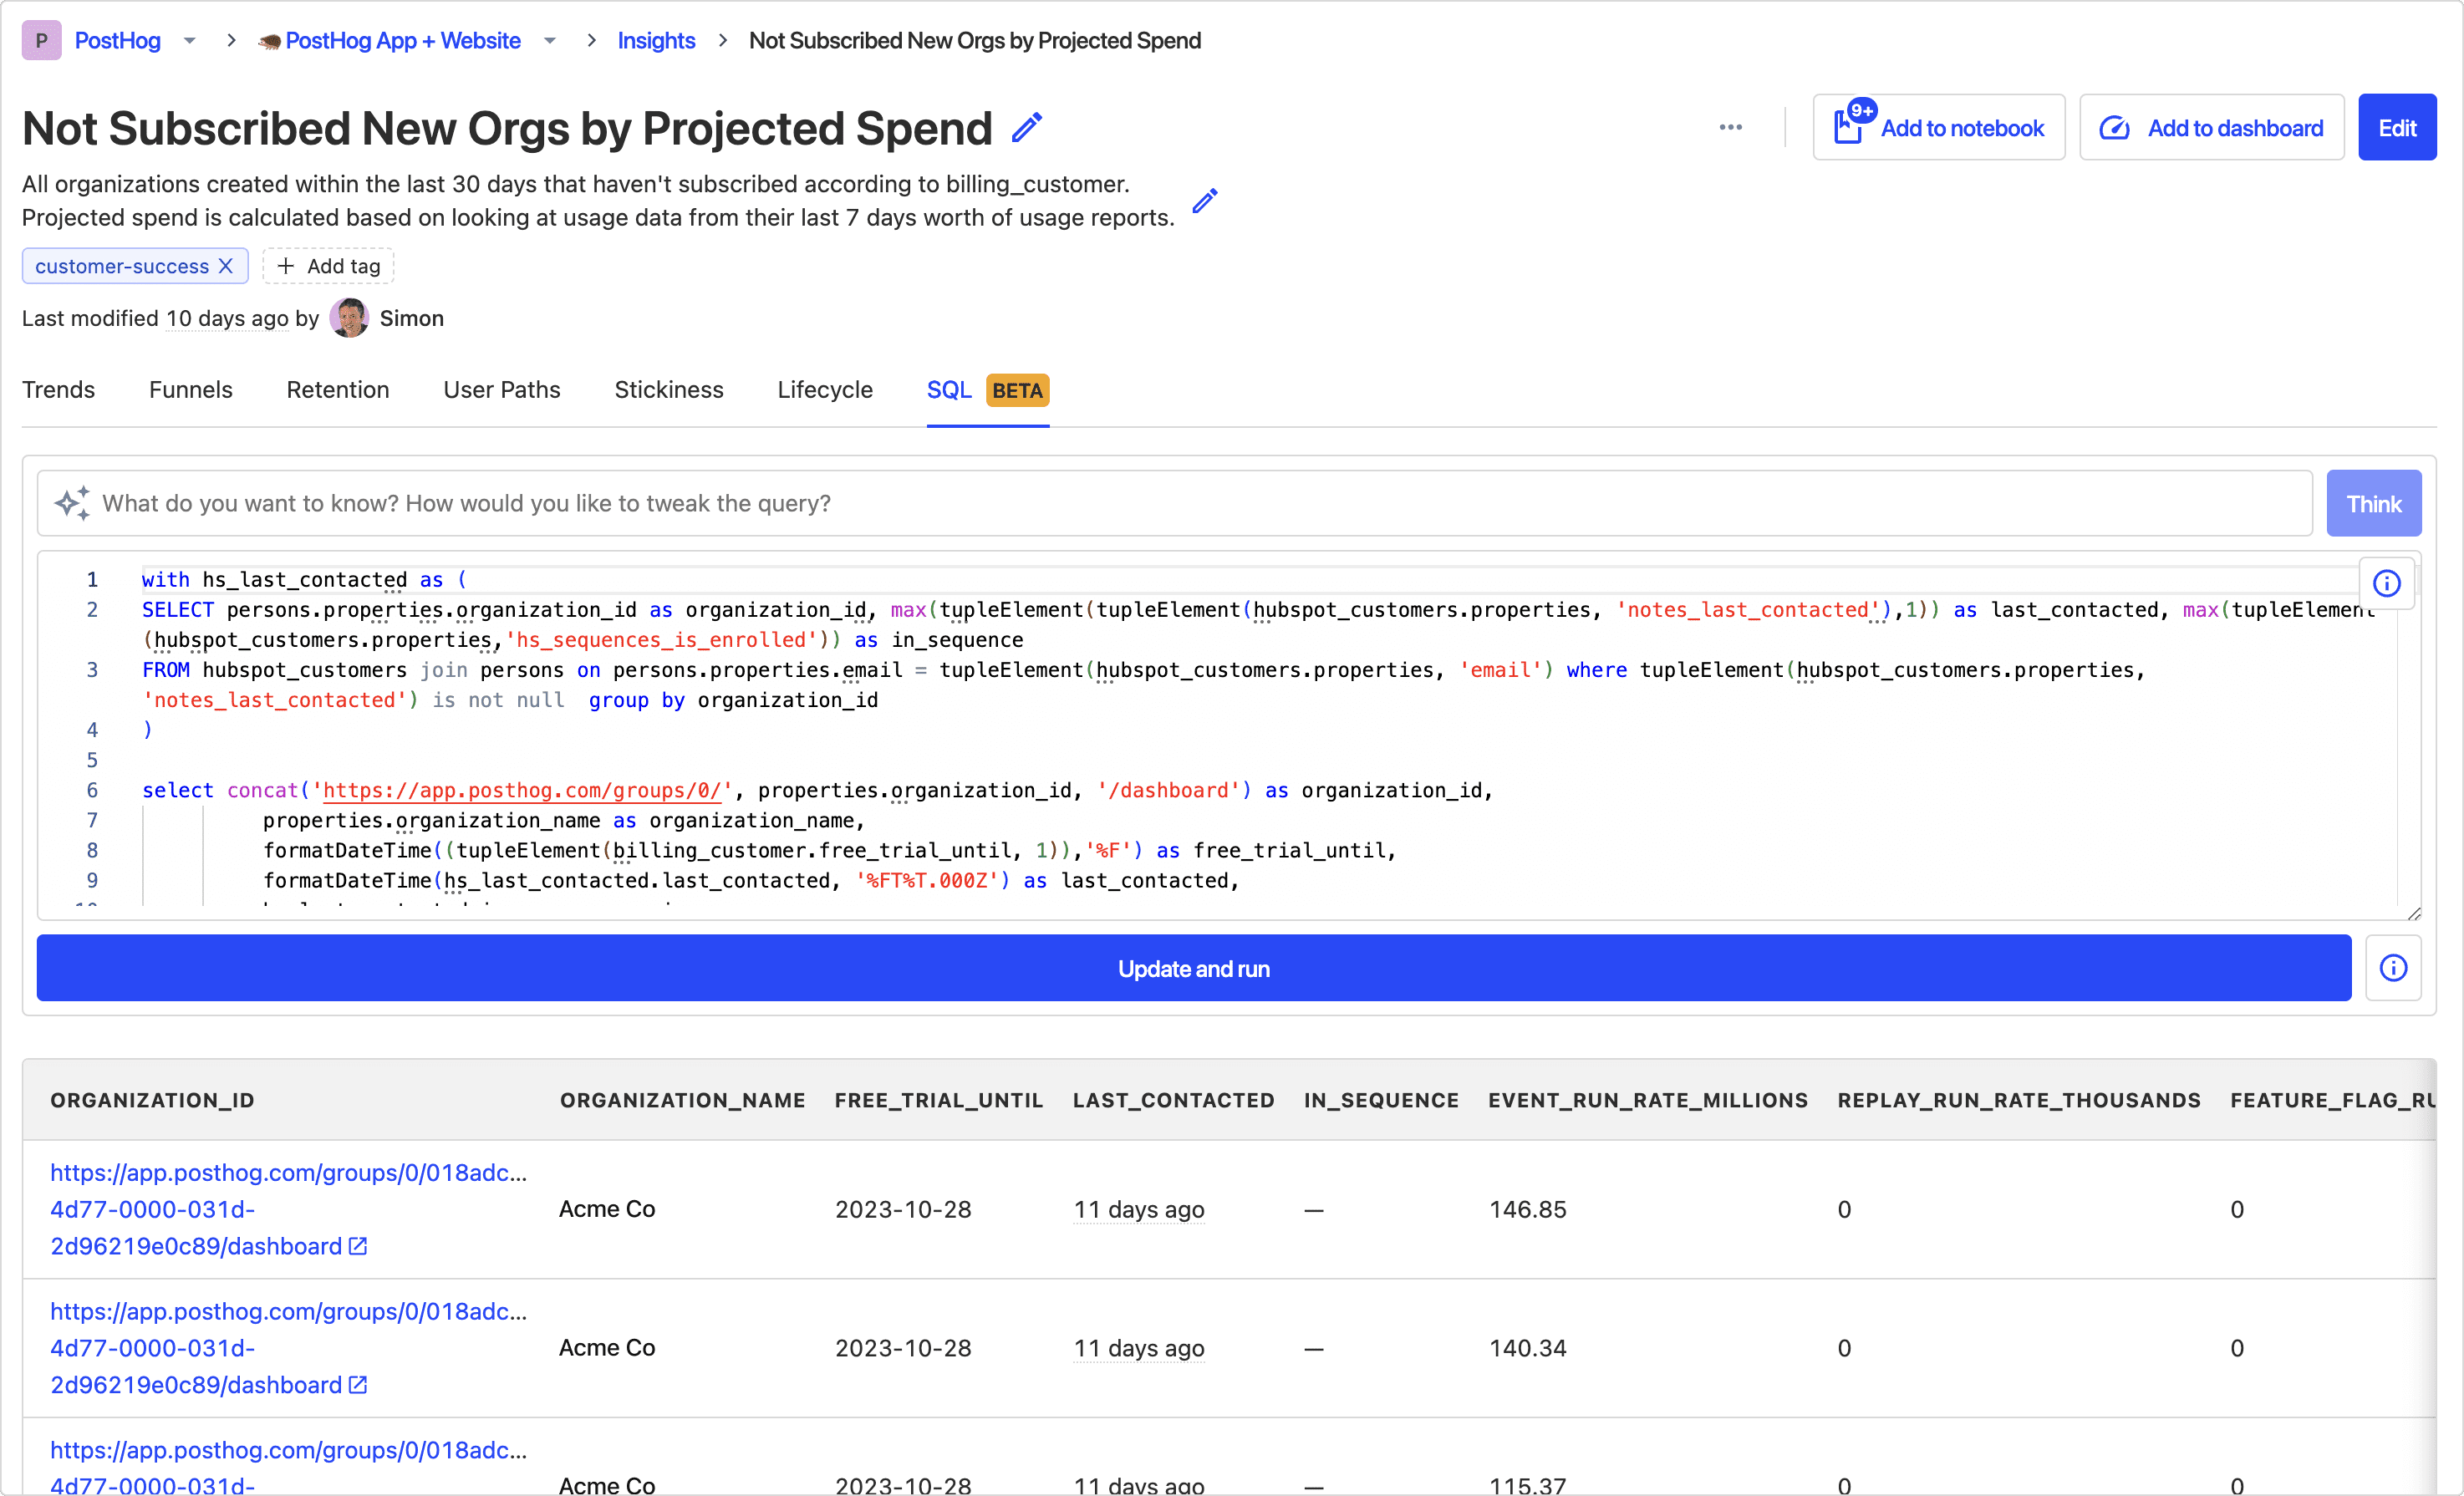
Filter data by person property, group data, and use formulas in queriesSQL
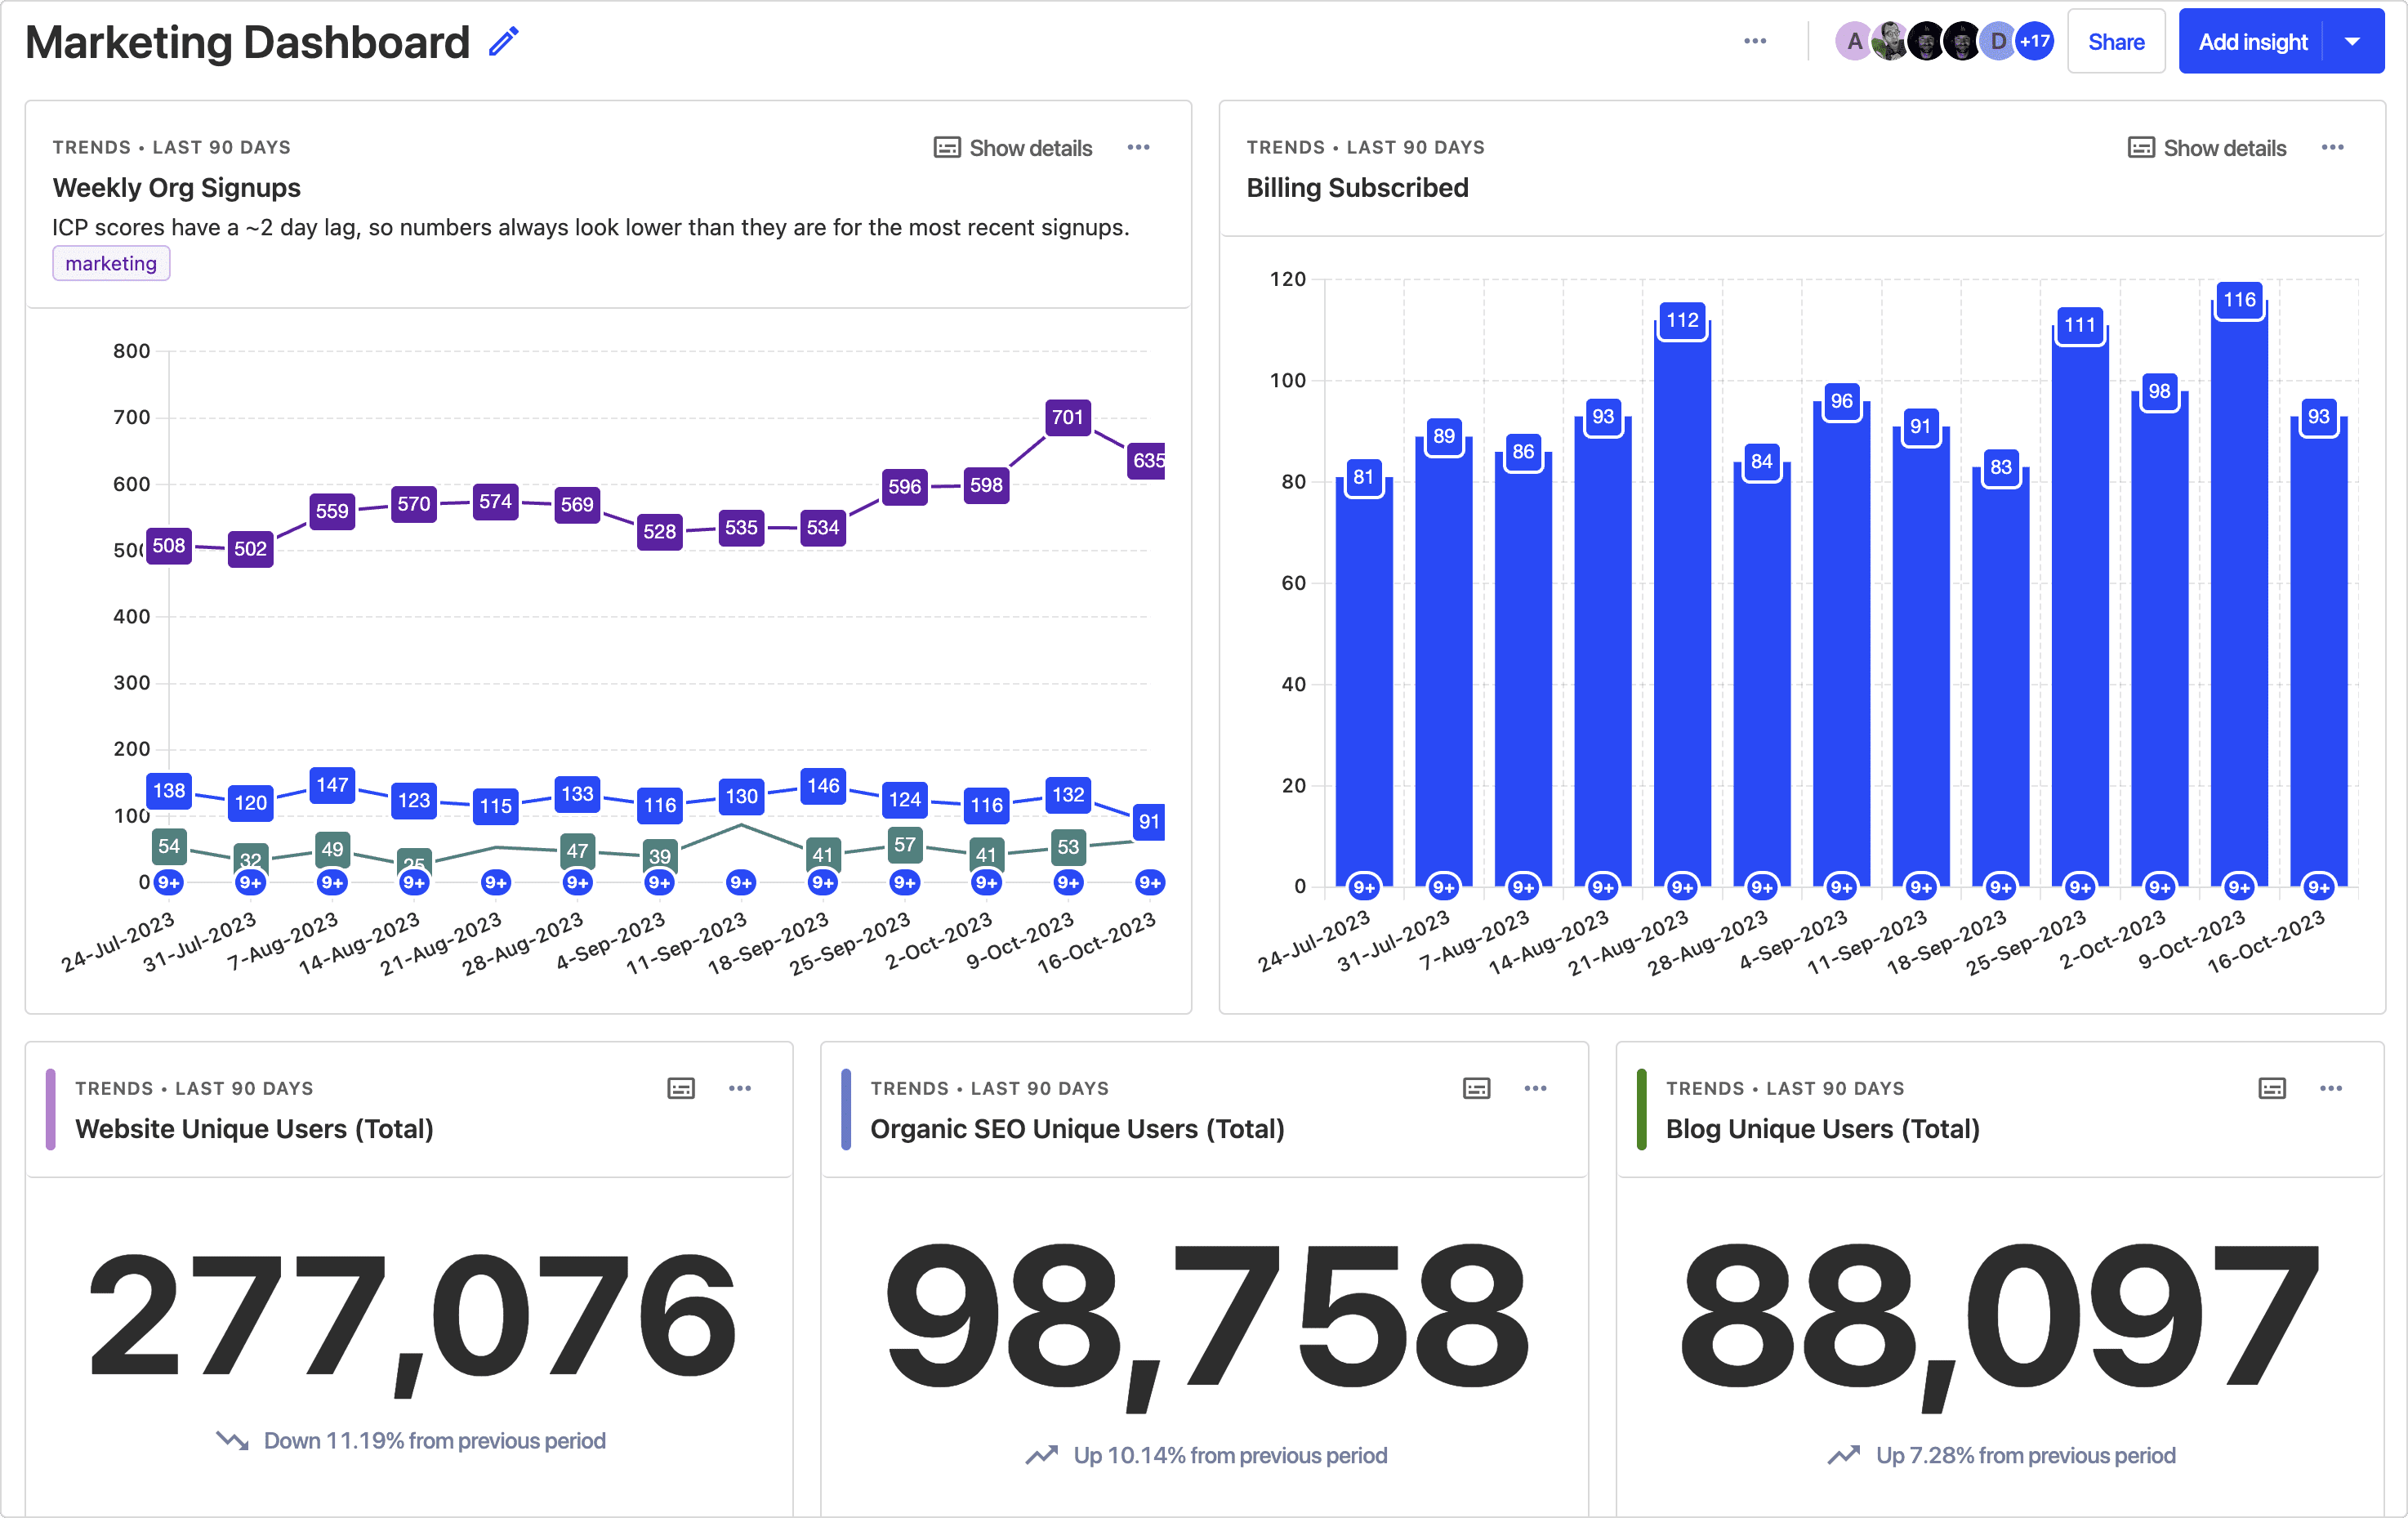
Use PostHog’s filtering interface or switch into SQL mode for more powerful queryingDashboards and insight subscriptions
Share insights with teams, and get updates when results changeGroup analytics
Analyze how any group of people (like an organization) use your productAI engineering
Integrate with existing monitoring tools and track latency, cost, and model performance
Answer all of these questions (and more) with PostHog Product analytics.
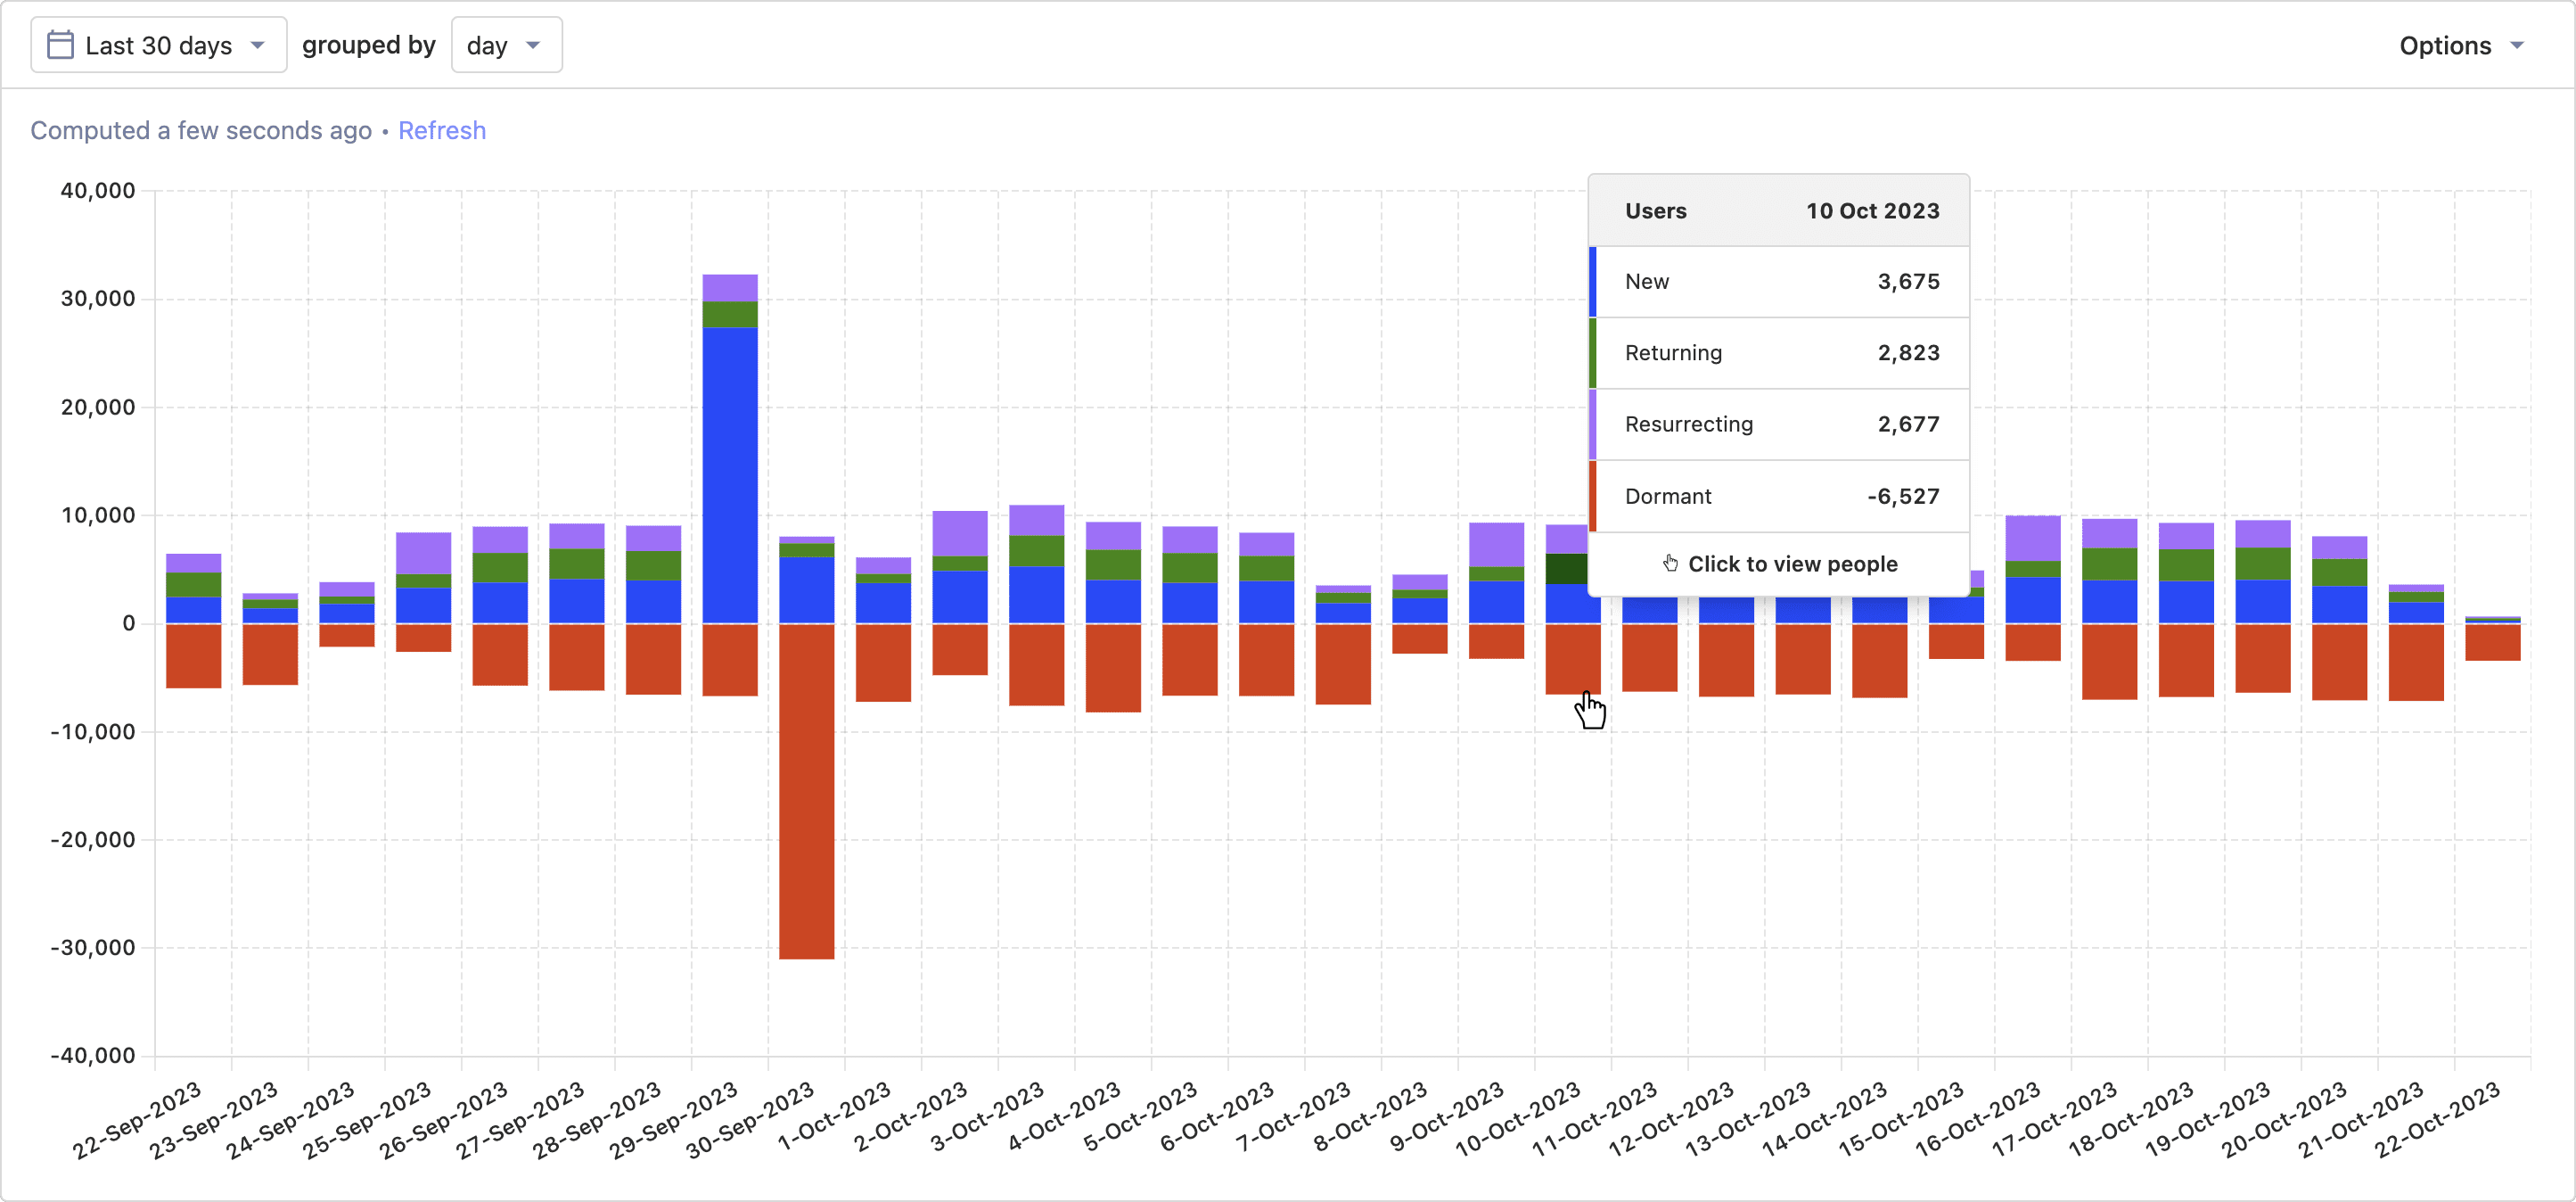
- How do I calculate new vs returning users?
- What’s my churn rate? / How can I lower my churn rate?
- What features have the highest churn?
- Which of my features increase user retention?
- How do I track ad conversion?
- How can I find my power users? / What are my power users doing differently?
- Where do my users spend the most time on?
- How do I get insights about my data using regex?
- How are my metrics changing over time?
- How does the usage of two feature compare?
- How does last week's release affect engagement?
- Which step(s) have the highest friction or time to convert?
- What long-term patterns are we seeing?
- Which cohorts can we find from usage patterns?
- How are changes improving my activation flow?
- How do event properties change over time?
- How is seasonality affecting conversion?
- How do far are my users scrolling down my app?
- How to I track performance marketing?
- How are my ads converting to paying customers?
- Which parts of our product are people using?
- Where are users getting stuck?
- How do I measure growth loops?
- What events correlate to success in my product?
- What properties correlate to success in my product?
- How many users return to use my product each day?
- How many users return to use my product each week?
- What features do users come back to use?
Usage-based pricing
Use product analytics free. Or enter a credit card for advanced features.
Either way, your first 1,000,000 events are free – every month.
Free
No credit card required
All other plans
All features, no limitations
Events
1,000,000/mo
Unlimited
Features
Dashboards
Funnels
Graphs & trends
User paths
Limited
Insight & dashboard subscriptions
Advanced paths
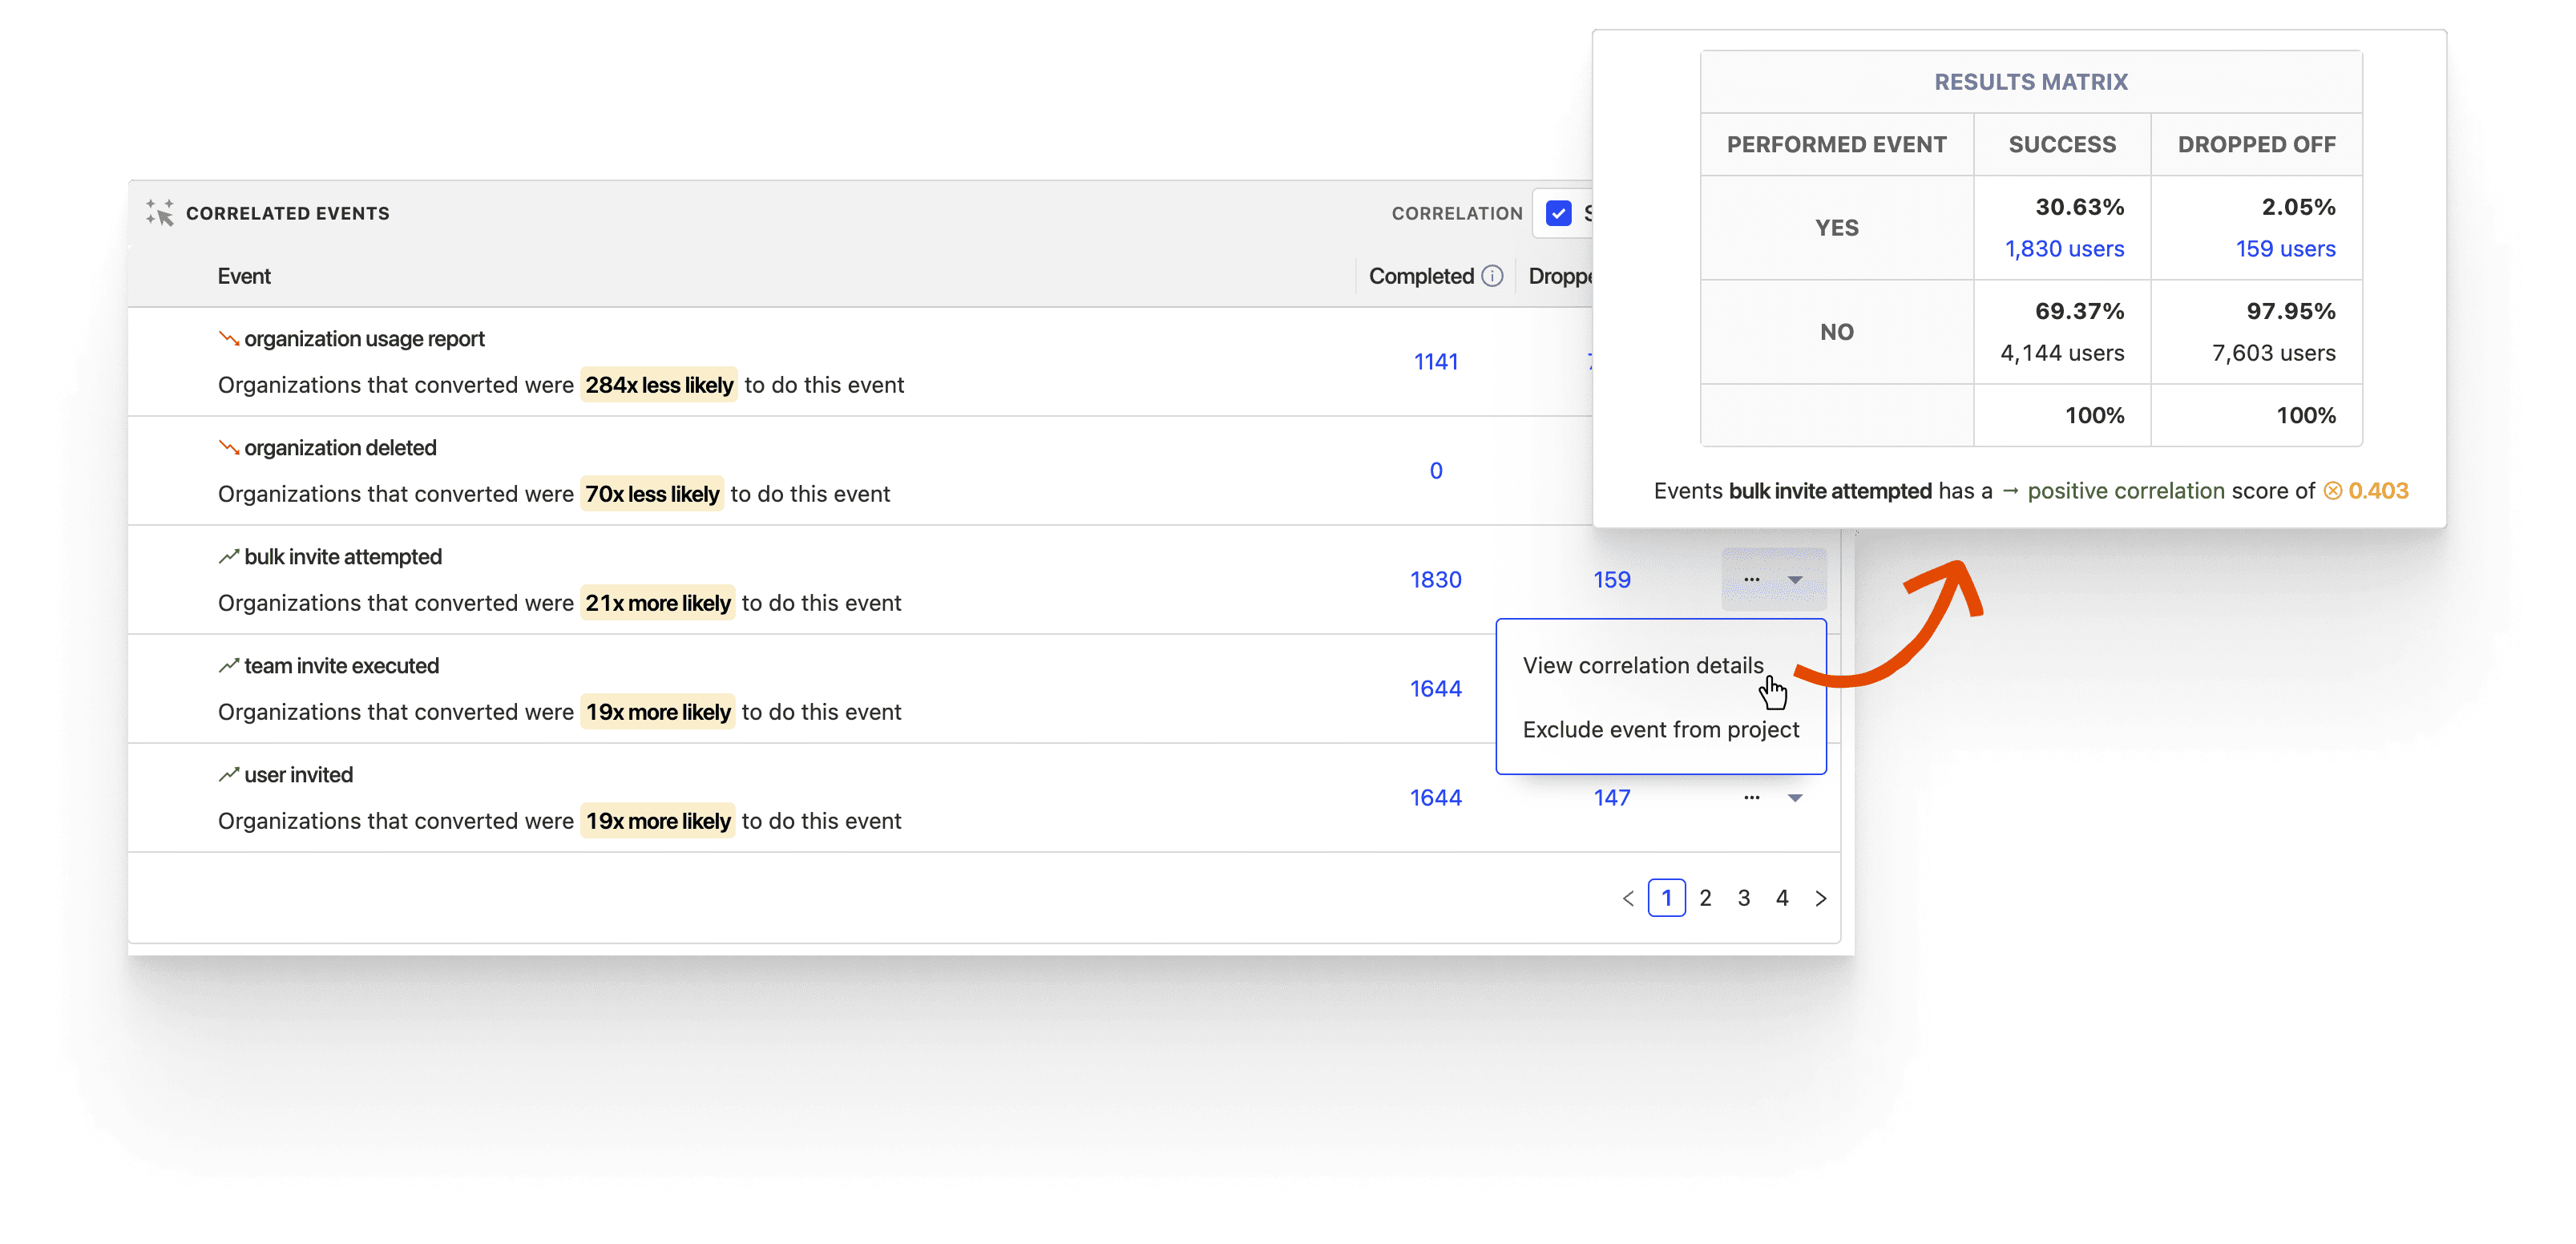
Correlation analysis
Lifecycle
Data retention
1 year
7 years
Person profiles
Add-onAvailable
Group analytics
Add-onAvailable
Data pipelines
Add-onAvailable
Monthly pricing
First 1 million events
Free
1-2 million
$0.0000500/event
2-15 million
$0.0000343/event
15-50 million
$0.0000295/event
50-100 million
$0.0000218/event
100-250 million
$0.0000150/event
250 million+
$0.0000090/event
FAQs
PostHog vs...
So, what's best for you?
Reasons a competitor may be best for you (for now...)
- Time-based analysis for web analytics (e.g. time on page)
- (We're working on this!)
- Natural language processing for creating insights
- Predictive analytics for extrapolating events into the future
- Alerting for when events move beyond set thresholds


Reasons to choose
- Linking between analytics and other features, so you can jump from a graph to a relevant recording
- Wide range of insight types for analyzing data
- Formula mode and SQL access to enable deeper analysis
- Automatic correlation analysis to find significant events
- Group analytics for teams with B2B customers
Have questions about PostHog?
Ask the community or book a demo.
Featured tutorials
Visit the tutorials section for more.
How to calculate and lower churn rate
In this tutorial, we will calculate and visualize the churn rate then use PostHog’s features of session recordings, cohorts, and actions to lower it.
How to filter and breakdown arrays with HogQL
Arrays (AKA lists) are a useful way to store multiple values related to each other under the same key. PostHog's HogQL expressions unlock the ability to make full use of them.
Calculate bounce rate
Bounce rate is the percentage of users who leave your page immediately after visiting. It is a popular marketing metric showing the relevance and engagement of content for site visitors.
How to calculate DAU/MAU ratio
The ratio of daily active users over monthly active users shows what percentage of your users are active and use your product every day.
Install & customize
Here are some ways you can fine tune how you implement product analytics.
Explore the docs
Get a more technical overview of how everything works in our docs.
Product analytics
Analysis views
Tools
Meet the team
PostHog works in small teams. The Product Analytics team is responsible for building product analytics.
(Shockingly, this team prefers their pizza without pineapple.)
Roadmap & changelog
Here’s what the team is up to.
Latest update
Sep 2024
Long dashboard lists will now load 93% faster
If, like us, you have a lot of dashboards (412 in our case) then you may have noticed that viewing the main dashboard page can sometimes take a while to load. No more!
All it took was a little bit of complaining in our internal Slack and suddenly Michael couldn't help himself – he made a few tweaks and, voila, dashboard views now load 93% faster.
Questions?
See more questions (or ask your own!) in our community forums.
- Question / TopicRepliesLast active
Pairs with...
PostHog products are natively designed to be interoperable using Product OS.
Session replay
Jump into a playlist of session recordings directly from any point in a graph, or segment of a funnel
Feature flags
See which feature flags were enabled for a user during a session
Experiments
Filter data down to users within an active experiment, whether part of a control group or a test variant
This is the call to action.
If nothing else has sold you on PostHog, hopefully these classic marketing tactics will.
PostHog Cloud
Digital download*
Notendorsed
by Kim K
*PostHog is a web product and cannot be installed by CD.
We did once send some customers a floppy disk but it was a Rickroll.